|
|
Post by greysrigging on Jan 6, 2024 16:48:45 GMT -5
 A warm and very rainy year - 164 rainy days, which is the 2nd highest on record behind 2022's 187 rainy days - for reference, the next highest was 158 rainy days in 2000, a strong La Nina year. It was perhaps the least snowiest year on record, with only four days seeing any snow at 948 m and no snow reported in Tumbarumba at any point this year (a town which usually sees at least two snowy days in any normal year). The lowest minimum in December was a balmy 8.3 °C, which smashed the previous record high lowest minimum of 6.7 °C in Dec 2003. December 2023 was extremely humid, with dew points in excess of 18 °C here and as much as 23 °C in Tumbarumba coupled with 31+ °C temps. Anomalies @ Hunters Hill (1993−2022) December- • Mean Maximum: 23.7 °C (+0.9 °C) • Mean Minimum: 13.3 °C (+1.4 °C) • Precipitation: 79.0 mm (101.28%) Annual- • Mean Maximum: 16.5 °C (+0.1 °C) • Mean Minimum: 8.2 °C (+0.3 °C) • Precipitation: 1,238.2 mm (100.60%) • Precipitation days: 164 (+26 days) • Seasonal Range: 17.3 °C (−1.4 °C); Jan 24.9 °C to Jun 7.6 °C  |
|
|
|
Post by cawfeefan on Jan 7, 2024 3:03:16 GMT -5
|
|
|
|
Post by Crunch41 on Jan 7, 2024 23:35:42 GMT -5
I plan to make one of these, but for now here's the NWS summary. Record warm, a full 10F above normal. The previous record was 37.7 in 2015, so this was a full 1.8F/1.0C above that. While there were some very warm days, the warmest was still 10F from the monthly record high (58 vs 68). The month was steadily above-average with only a single day below the daily mean (35/18F on the 19th, 2.0F below normal).  Other monthly records: Lowest monthly max only 35F, previous record was 33 in 1931. 0 ice days (max <=32F), also happened in 1931 8 days >= 50F, tied with 2015, 1994, 1877 Only 10 days with min <=32, previous record 12 in 1877. Lowest monthly min 18F, previous record was 17 in 1913. Trace snowfall, tied with 1943 and 1894 0 days with measurable snow depth. Several other years have reported a trace, but this year did not. I don't think that means anything. The two other winters with little snow somehow reported trace snow depth on a few days when only a trace fell. Trace does not mean much... Madison summary |
|
|
|
Post by MET on Jan 10, 2024 9:43:30 GMT -5
Now with updated (provisional) sun hours.  |
|
|
|
Post by flamingGalah on Jan 11, 2024 13:50:00 GMT -5
Another wet month, above average temperature wise & below average sunshine. Stats from my PWS Av.Max 9.7C (+0.7C*) Av.Min 5.7C (+2.4C*) Mean 7.7C (+1.5C*) Highest Max 12.7C (9th & 21st) Lowest Min -2.9C (2nd) Lowest Max 1.8C (1st) Highest Min 11.3C (9th & 25th) Rainfall 178.6mm (193%*) Days with Rain 21 Days with >1.0mm 16 Days with Thunder 1 Days with Hail 2 Sunshine 52.9hrs (88%*) Max UV 1 Min UV 1 High Sea Temp 11.8C Min Sea Temp 9.7C Mean Sea Temp 10.4C *against Thorney Island 1991-2020 averages     |
|
|
|
Post by aabc123 on Jan 15, 2024 17:22:28 GMT -5
December summary. Also like the previous two months, December was colder than average both at my place and on the coast. Precipitation was above average in my area and slightly below average on the west coast.  |
|
|
|
Post by Cadeau on Jan 31, 2024 20:24:06 GMT -5
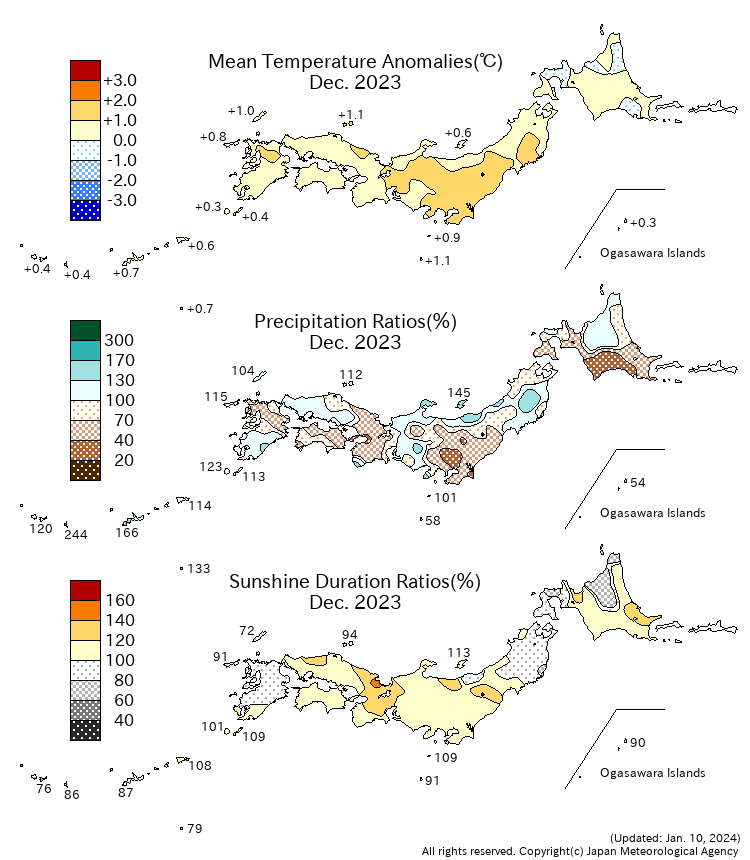
▼ <Monthly Climate Anomaly over Japan>

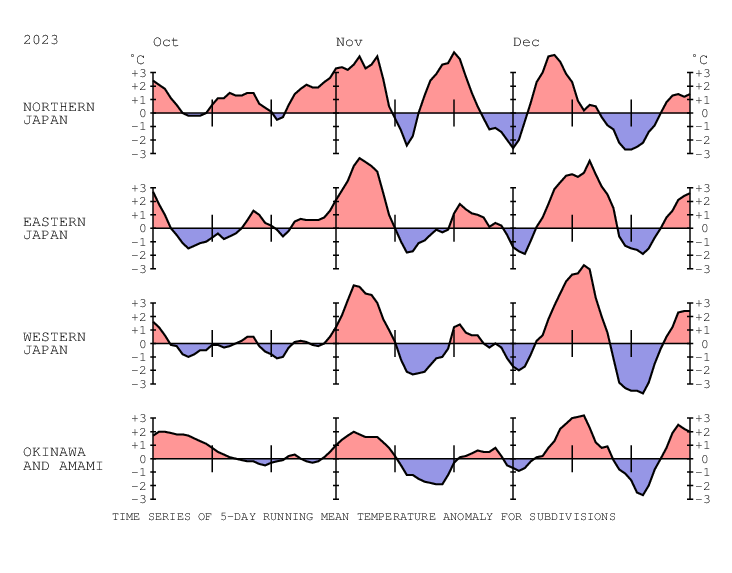
▼ <Time Series of Temperature Anomaly>

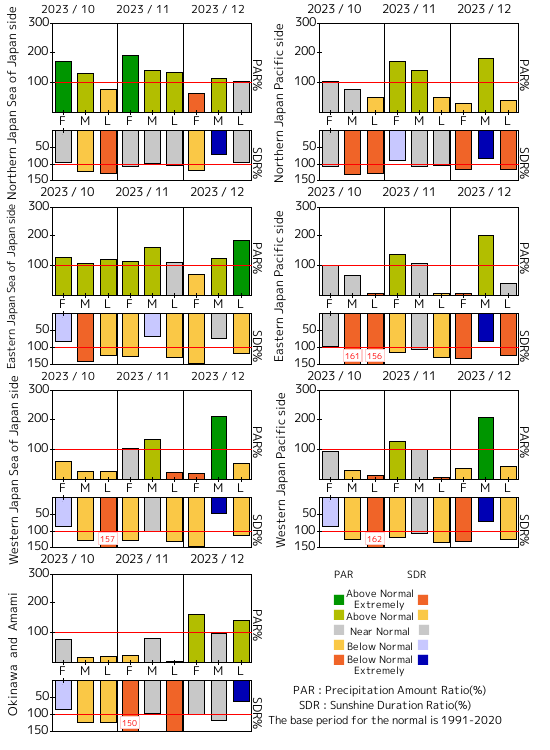
▼ <Time Series of 10days Precipitation Amount Ratio and Sunshine Duration Ratio>

▼ <10-day Mean Sea Level Pressure>
▼ <10-day Mean 850hPa Temperature>
▼ <10-day Mean 500hPa GeoPotential Height>
▼ <10-day Mean Outgoing Longwave Radiation>
|
|