|
|
Post by greysrigging on Jan 31, 2024 5:25:31 GMT -5
Finally... the brutal 'build up' of Oct-early Jan fucked off and we had a well above average month of monsoonal rainfall ! What a difference a few weeks makes.... the first week of Jan, Darwin Airport recorded 5 days +35c.... previous record only 2 such days in January. Since the 9th, we have has 22 consecutive days of rain and subsequently well above average rainfall ( and below average max temps ). In fact Jan 2024 was below the long term mean for max temps.... 31.6c ( -0.2c below average ). The western and south western Top End were impacted by a slow moving tropical low depression system md January, with some sites recording over a 1000mm ( 40") for the month and record flooding. The main North-South Highway and Railway were washed out and closed, the Victoria Highway to WA is still closed ( 2 weeks now. ) A completely different story over the eastern Top End with Gove only recording 333mm so far this wet season , as well as weeks of +35c temps, well above the norm... Alice Springs has endured a relatively typical January re rainfall; 40mm almost right on average. Max temps running +2.9c above the long term mean and mins +2.6c... so a hot month with 12 days +40c    Rainfall - 531.6mm falling on 27 days ( long term mean 429.8mm) Highest daily fall - 69.0mm on the 8th Max temps - 31.6cc av ( long term mean 31.8c ) Highest max - 35.6c on the 2nd. Lowest max - 28.2c on the 25th Min temps - 25.6c av ( long term mean 24.9c ) Highest min - 29.9c on the 1st. Lowest min - 22.6c on the 30th.      Rainfall - 40.2mm falling on 8 days ( long term mean 42.9mm) Highest daily fall - 20.2mm on the 8th Max temps - 39.3c av ( long term mean 36.4c) Highest max 42.9c on the 24th. Lowest max 34.3c on the 20th. Min temps - 24.2c av ( long term mean 21.6c ) Highest min 29.6c on the 29th. Lowest min 16.6c on the 1st.   |
|
|
|
Post by Benfxmth on Jan 31, 2024 19:36:53 GMT -5
Synopsis: A bit more interesting than the past few months. The first half of the month was fairly unsettled, with some days of Hurricane Mcghee tossed into the mix. Thereafter, a cold snap brought the coldest temps of winter thus far, followed by an anomalous warm spell with the third January of the 2020s to see a temp at or above 80°F. In between all that, there were plenty of sunny cool crisp days and not much in the way of cold overcast. All-in-all, not a bad winter month at all.    Average 1 AM temperature: 43.5°F (6.4°C) Average 7 AM temperature: 42.4°F (5.8°C) Average 1 PM temperature: 53.9°F (12.2°C) Average 7 PM temperature: 48.7°F (9.3°C) Average 1 AM dewpoint: 38.0°F (3.3°C) Average 7 AM dewpoint: 37.2°F (2.9°C) Average 1 PM dewpoint: 40.0°F (4.4°C) Average 7 PM dewpoint: 39.5°F (4.2°C) Max. dewpoint: 70.0°F (21.1°C) on the 26th, 1:38 PM; dry-bulb temperature 79.0°F (26.1°C) Min. dewpoint: 4.8°F (-15.1°C) on the 21st, 2:27 AM; dry-bulb temperature 24.1°F (-4.4°C) Difference between true daily mean vs. max/min / 2: 0.0°F (0.0°C) Largest diurnal range: 30.9°F (17.2°C) on the 12th Smallest diurnal range: 9.5°F (5.3°C) on the 20th Mean time of daily high and mean time of daily high after solar noon (not including highs which occurred at night): 2:22 PM; +2 hrs and 5 mins No. precipitation days (>=0.01"): 12 No. precipitation days (>=0.04"): 8 No. precipitation days (>=0.1"): 5 No. precipitation days (>=0.4"): 1 No. precipitation days (>=1"): 1 Max. rainfall rate (1-min. avg.): 4.20"/hr (106.7 mm/hr) on the 9th, 8:29 PM Max. rainfall rate (10-min. avg.): 1.86"/hr (47.2 mm/hr) on the 9th, 6:20-6:30 PM Max. temperature of measurable precipitation: 68.3°F (20.2°C) on the 9th, 5:38 PM Min. temperature of measurable precipitation: 42.3°F (5.7°C) on the 4th, 4:41 AM Highest barometric pressure: 30.71 in (1040.0 mb) on the 22nd Lowest barometric pressure: 29.33 in (993.2 mb) on the 9th _______________________________________________________________________ New/Tied (Monthly) Records at New Bern ASOS (KEWN): 77 mph (67 kt; 124 kph) wind gust on Jan 9, 2024, 8:24 PM during a QLCS* *Miscellaneous record not in NOWData, but noteworthy enough to get a mention and also the highest wind gust in any winter month _______________________________________________________________________ Monthly departures at New Bern ASOS (relative to 1991-2020 normals): Average high: +3.4°F (+1.9°C; 76th percentile; 17th warmest on record) Mean: +2.4°F (+1.3°C; 73rd percentile; 19th warmest on record) Average low: +1.5°F (+0.8°C; 66th percentile; 24th warmest on record) Precipitation: -1.42" (-36.1 mm; 63% of normal; 30th percentile; 22nd driest on record) ________________________________________________________________________  |
|
|
|
Post by MET on Jan 31, 2024 19:38:27 GMT -5
January 2024 Summary, SE Sheffield. First January ever with no snow. Highest January temperature ever reached on 23rd during my time here. It was average in the first week, then very cold and drier with high pressure, then mild towards the end. Rainfall and temperatures were basically average over-all.  
|
|
|
|
Post by Cadeau on Jan 31, 2024 20:32:42 GMT -5
Mild start, much colder in the middle, much warmer later made an average January as a wholeParis, Île-de-France, France January 2024 Average: High 7.6°C / Low 3.0°C / Mean 5.3°CHighest: 14.5°C [24th] Lowest: -3.9°C [20th] Lowest High: -1.2°C [9th] Highest Low: 11.8°C [24th] Precipitation: 63.7 mmPrecipitation Days: 9 Sunshine Hours: 91.1 hours Sunshine Percentage: 33.5% Early January: High 6.8°C / Low 4.2°C / Mean 5.5°C / Precipitation 24.3 mm / 15.6 sunshine hours Mid January: High 3.3°C / Low -1.7°C / Mean 0.8°C / Precipitation 33.0 mm / 41.1 sunshine hours Late January: High 12.1°C / Low 6.1°C / Mean 9.1°C / Precipitation 6.4 mm / 34.5 sunshine hours  - Seoul, South Korea January 2024 Average: High 3.6°C / Low -3.9°C / Mean -0.5°CHighest: 10.6°C [31st] Lowest: -14.0°C [23rd] Lowest High: -8.2°C [23rd] Highest Low: 4.0°C [19th] Precipitation: 18.9 mmPrecipitation Days: 4 Snowfall: 13.4 cm Snowy Days: 4 Average Relative Humidity: 66.6% Average Wind Speed: 2.3 m/s Sunshine Hours: 177.4 hours Sunshine Percentage: 57.8% Early January: High 3.7°C / Low -2.8°C / Mean 0.4°C / Precipitation 4.6 mm / 43.1 sunshine hours Mid January: High 4.8°C / Low -2.0°C / Mean 1.1°C / Precipitation 13.7 mm / 50.0 sunshine hours Late January: High 2.3°C / Low -6.7°C / Mean -2.7°C / Precipitation 0.6 mm / 84.3 sunshine hours  - Tokyo, Japan January 2024 Average: High 11.8°C / Low 2.9°C / Mean 7.1°CHighest: 15.6°C [6th] Lowest: -1.1°C [25th] Lowest High: 7.0°C [16th] Highest Low: 7.6°C [19th] Precipitation: 36.0 mmPrecipitation Days: 3 Snowfall: 0 cm Snowy Days: 0 Average Relative Humidity: 54% Average Wind Speed: 2.6 m/s Sunshine Hours: 198.5 hours Sunshine Percentage: 64% Early January: High 12.3°C / Low 3.4°C / Mean 7.5°C / Precipitation 0.0 mm / 62.5 sunshine hours Mid January: High 11.0°C / Low 2.1°C / Mean 6.5°C / Precipitation 4.5 mm / 60.2 sunshine hours Late January: High 12.0°C / Low 3.0°C / Mean 7.2°C / Precipitation 31.5 mm / 75.8 sunshine hours  Note: Tokyo had the warmest average high in the recorded history. Note: Tokyo had the warmest average high in the recorded history.
|
|
|
|
Post by tommyFL on Feb 1, 2024 0:30:25 GMT -5
January 2024 SummaryWarmer than normal (+2.3 °F/+1.3 °C/79th percentile) with near-normal precipitation (58% of average precipitation/50th percentile). The 15th consecutive warmer than normal month.    Highest daily max temp: 86.0 °F (30.0 °C) on the 27th Mean daily max temp: 74.4 °F (23.6 °C)Lowest daily max temp: 64.3 °F (17.9 °C) on the 11th Highest daily mean temp: 74.9 °F (23.8 °C) on the 27th Mean temp: 65.6 °F (18.7 °C)Lowest daily mean temp: 54.9 °F (12.7 °C) on the 29th Highest daily min temp: 70.9 °F (21.6 °C) on the 24th Mean daily min temp: 57.6 °F (14.2 °C)Lowest daily min temp: 45.4 °F (7.4 °C) on the 21st Highest diurnal range: 29.4 °F (16.3 °C) on the 28th Mean diurnal range: 16.9 °F (9.4 °C)Lowest diurnal range: 7.6 °F (4.2 °C) on the 24th Precipitation: 1.13" (28.7 mm)Number of days with precipitation ≥ 0.01" (0.3 mm): 12 daysHighest daily precipitation: 0.30" (7.6 mm) on the 13th Highest instantaneous precipitation rate: 4.74"/hr (120.4 mm/hr) on the 9th Duration of measurable precipitation: 21.4 hours (2.9% of the month)Highest temp with measurable precipitation: 77.6 °F (25.3 °C) on the 28th Mean temp of measurable precipitation: 69.4 °F (20.8 °C)Lowest temp with measurable precipitation: 60.2 °F (15.7 °C) on the 11th Highest relative humidity: 100% on the 1st, 6th, 7th, 12th, 16th, 19th, and 20th Mean daily max relative humidity: 96.8%Highest daily mean relative humidity: 97.1% on the 16th Mean relative humidity: 84.9% Lowest daily mean relative humidity: 66.0% on the 22nd Mean daily min relative humidity: 66.7%Lowest relative humidity: 44% on the 2nd Highest dew point: 77.3 °F (25.2 °C) on the 16th Mean daily max dew point: 66.3 °F (19.1 °C)Highest daily mean dew point: 71.3 °F (21.8 °C) on the 12th Mean dew point: 60.6 °F (15.9 °C)Lowest daily mean dew point: 47.6 °F (8.7 °C) on the 21st Mean daily min dew point: 54.2 °F (12.3 °C)Lowest dew point: 41.0 °F (5.0 °C) on the 21st Highest barometric pressure: 30.45 inHg (1031 mbar) on the 22nd Mean barometric pressure: 30.10 inHg (1019 mbar)Lowest barometric pressure: 29.77 inHg (1008 mbar) on the 9th Largest 1-day mean temp rise: 14.6 °F (8.1 °C) between the 11th and 12th Largest 1-day mean temp drop: 15.5 °F (8.6 °C) between the 28th and 29th Mean daily variability (average difference in mean temp between consecutive days): 4.9 °F (2.7 °C)Observations are from 12 AM to 12 AM New January monthly records at Port Salerno 5W COOP station (1.3 mi/2.1 km SE) (since May 2002):Record highest positive daily mean temp anomaly: +13.6 °F (+7.6 °C). Previous record +13.1 °F (+7.3 °C) in 2005.Record highest number of days with min temp ≥ 70 °F (21 °C): 4 days. Previous record 2 days in 2006.Observations are from 7 AM to 7 AM Full period of record averages for Port Salerno 5W COOP station for reference: Sunshine hours at Martin County Emergency Operations Center for 2024 and averages since 2020 (calculated from solar radiation):  Highest daily sunshine: 89% (9.5 hours) on the 29th Lowest daily sunshine: 0% (0.0 hours) on the 6th, 7th, 8th, 11th, 14th, 15th, 18th, and 19th  My other stations: Allapattah Flats Apopka Key Biscayne (beginning January 28th)
|
|
|
|
Post by Steelernation on Feb 1, 2024 0:34:32 GMT -5
January was an average month—median was exactly average. I missed the first third but once I got back it was a great month with a short lived extreme cold snap and then a long period of mild, pleasant weather. Average high: 41.9 (-3.1 f) Average low: 14.9 (-3.4 f) Mean: 28.4 (-3.2 f) Precipitation: 0.23” (-0.18”, 56%) Precip days: 3 Snowfall: 3.4” (-3.3”, 51%) Snow days: 3 Max snow depth: 3” on the 15th and 16th Days snow lying: 9 Highest temp: 64 on the 29th Lowest temp: -17 on the 16th —coldest since 1984Highest low: 31 on the 26th Lowest high: 3 on the 15th Month (00-00, AgMet):  Year (7 PM-7 PM, coop):  |
|
Deleted
Deleted Member
Posts: 0
|
Post by Deleted on Feb 1, 2024 2:59:26 GMT -5
|
|
|
|
Post by longaotian on Feb 1, 2024 3:56:08 GMT -5
|
|
|
|
Post by Morningrise on Feb 1, 2024 6:25:34 GMT -5
January was a serious mixed bag, with the unseasonal mildness of Nov/Dec continuing for the first few days of the year, then a brutal cold snap dominated the middle of the month, followed by another wave of unseasonal mildness. We went from a snowless October-like landscape, to proper mid-winter scenery, to March-like snow melt and messiness all in a few weeks, and we had an even bigger spread between record highs/lows than usual - a 47.8C difference between the warmest and coldest temperatures recorded in the month, and a 41.3C difference between the warmest and coldest highs. Definitely a bit of a roller coaster ride! Average high: -10.8C (normal: -10.1C) Average low: -19.4C (normal: -20.7C) Mean temperature: -15.1C (normal: -15.5C) Warmest high: 8.3C (Jan 30th) Warmest low: -1.6C (Jan 30th) Coldest high: -33.0C (Jan 13th) Coldest low: -39.5C (Jan 12th) Precipitation total: 5.6mm (normal: 14.8mm) Precipitation days: 4 (normal: 10.3)  |
|
|
|
Post by jgtheone on Feb 1, 2024 7:17:28 GMT -5
Essendon January 2024 Summary:Average max: 26.0°C (-1.5°C) Average mean: 20.9°C (-0.4°C) Average min: 15.7°C (+0.7°C) Max high: 34.3°C (12th) Max low: 21.8°C (8th) Min high: 20.2°C (21st) Min low: 10.6°C (27th) Precipitation: 94.0mm (221.2% of avg. precip) Precip days: 9 Precip days (>1mm): 6 Sun hours: 232.8hrs (86.0% of avg sun hours) Highest wind gust: 70km/h from the W (18th) While there is nothing different to say about this month compared to the past few months, it should be noted how stable the summer was. Considering the average of 26°C, the highest max was 34.3°C and the lowest max was 20.2°C. Ridiculously stable for Melbourne. The highest maximum being 34.3°C is the lowest value since around the 70s, at least for Essendon (which is missing data from 1972-2003). Melbourne Airport has a 'highest max' of 34.7°C in Jan 1986 and 32.0°C in Jan 1984, so that was likely the last time we had the hottest temperature of January being so low. Even with such a mediocre month, it is pleasing to see a lack of maximums below 20°C. Even though 19°C and 20°C are effectively the same thing, it just looks nicer and I hope this trend continues. 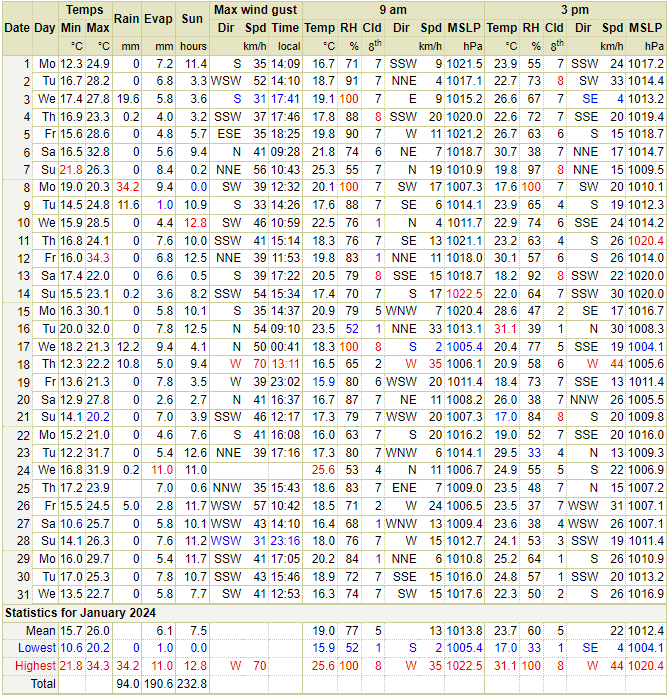 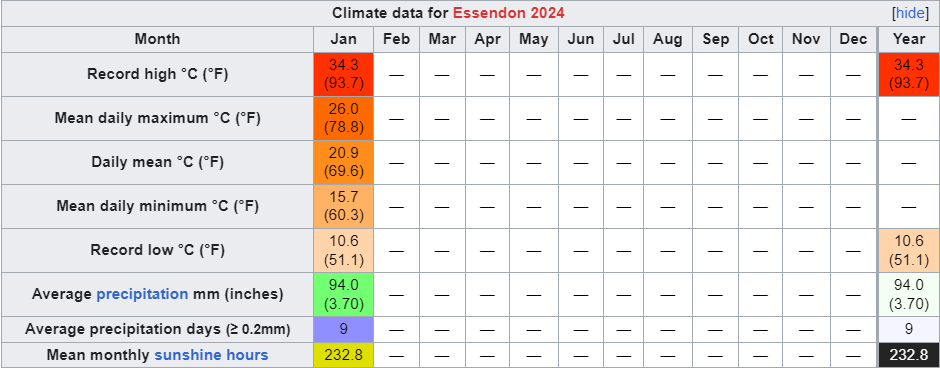
|
|
|
|
Post by kronan2 on Feb 1, 2024 10:31:45 GMT -5
 avg high: -1.3C mean: -1.8C avg low: -2.2C precipitation: +20% sunshine: +26h A very split month. The first two thirds of the month were very cold, followed by a mild and wet ending. Also the sunniest January recorded (Previous record 69h in 2022)  |
|
|
|
Post by Steelernation on Feb 1, 2024 12:03:08 GMT -5
Additional stats:
Median high: 45.0 (+3.1 f from mean)
Median low: 18.0 (+3.1 f from mean)
True daily mean: 27.4 (-1.0 f from mean)
Mean dew point: 13.6
Mean RH: 60.6%
Highest dew: 31.8 on the 24th (-0.1 c)
Lowest dew: -20.4 on the 16th (-29.1 c)
Lowest RH%: 11.8% on the 10th (39.0/-9.8 t/td)
Mean 3 PM temp: 38.3 (3.5 c)
Mean 3 PM dew: 13.1 (-10.5 c)
Mean 3 PM RH: 38.4%
Mean 9 AM temp: 27.1 (-2.7 c)
Mean 9 AM dew: 13.5 (-10.3 c)
Mean 9 AM RH: 59.8%
Sunshine*: 205 hours
Sun %*: 69%
*= estimated from solar radiation
|
|
|
|
Post by Wildcat on Feb 1, 2024 12:56:48 GMT -5
This month featured a coldest day that was 25.9ºF below average and a warmest day that was 27.3ºF above average. The end result...a "normal" January in Lexington. Average High: 40.7ºF ( -1.6ºF) Average Low: 27.2ºF ( +1.8ºF) Mean Temp: 33.9ºF (+0.0ºF) Precipitation: 6.05" (177% of normal) Snowfall: 5.4" (115% of normal)   |
|
|
|
Post by srfoskey on Feb 1, 2024 15:34:22 GMT -5
|
|
|
|
Post by Speagles84 on Feb 1, 2024 17:47:28 GMT -5
January 2024 Summary - Mild, cold, very warm and WET/snowy   |
|
|
|
Post by Beercules on Feb 1, 2024 19:09:54 GMT -5
bog standard, average, forgettable month, except for one intense thunderstorm, and some high humidity with extended periods of 20C+ dewpoints in the 1st half  |
|
|
|
Post by jetshnl on Feb 1, 2024 23:51:50 GMT -5
Not a remarkable month here. No daily records were set. We missed out on the warm and cold weather that AB got. Av max: -8.4C (+3.0) Av mean: -12.2C (+4.1) Av min: -15.8C (+5.4) Lowest max: -23.2C Highest min: -0.6C     |
|
|
|
Post by CRISPR on Feb 2, 2024 3:24:59 GMT -5
Ulladulla 2024 January Summary:Nothing too remarkable: but below average for sure. Most of the month was warm, with a mixture of drizzle, cloud and sunshine. It was significantly cloudier (-83.8 hr) and drier (-25.5 mm) than on average, a combo that I dislike. Not much extreme events occurring, other than several very warm days towards the middle of the month; and 1 hot day (21st) reaching 37.4ºC. *For some silly reason, the 1st recorded a humidity of 1% at 9 am, which is obviously fake.
Overall Stats:Mean Max: 24.3ºC (exactly average)
Mean Min: 18.8ºC (+1.2ºC, 4th warmest)
Rainfall: 66.4 mm (-25.5 mm)
Rain days (≥ 1.0 mm): 11 (+1.1 days)
Mean humidity (averaging 9 am and 3 pm): 79% (+5%)
Mean dew point (calculated from humidity): 17.8ºC (+1.6ºC)
Sunshine (with a calculator): 166.2 hours (-83.8 hours) (2nd dullest)
Percent Sun: 38.1% (2nd dullest, -19.1%)
Wind speed (averaging 9 am and 3 pm): 12 km/h (-4.75 km/h)
Specific Stats:Highest Max Temp: 37.4ºC on the 21st (NW wind)
Lowest Max Temp: 20.6ºC on the 31st (SE wind)
Highest Min Temp: 21.4ºC on the 3rd (NE wind)
Lowest Min Temp: 15.1ºC on the 19th (W wind)
Wettest day: 14.8 mm on the 18th (S wind)
Highest humidity (averaging 9 am and 3 pm): 96.5% on the 11th (SW wind)
Lowest humidity ('' ''): 52% on the 21st (NW wind)
Sunniest day: 31.5 MJ/m2 on the 10th (NE wind, WTF, but ok)
Cloudiest day: 4.9 MJ/m2 on the 31st (SW wind)
Calmest day (averaging 9 am and 3 pm): 5 km/h on the 25th
Windiest day ('' ''): 23.5 km/h on the 22nd (cool change from the 21st)
Max Pressure ('' ''): 1024.1 hPa on the 15th (still cloudy and mild af)
Min Pressure ('' ''): 1001.5 hPa on the 26th (some light rain throughout the day)
Highest diurnal: 17.7ºC on the 21st (NW wind)
Lowest diurnal: 1.3ºC on the 31st (SW wind- cooler at 3 pm than 9 am)
Month summary: Note that Dew points and sunshine were calculated with a calculator.  Daily summary: Daily summary: Includes solar exposure (MJ/m 2): Note that 'average' sunshine here translates to about 57.2% or 250 hours.
|
|
|
|
Post by segfault1361 on Feb 2, 2024 8:20:36 GMT -5
Toronto is on track to have a humid subtropical (Cfa) climate under the -3C isotherm for the second year in a row... yes, I just used Toronto and "subtropical" in the same sentence.  |
|
|
|
Post by Ariete on Feb 2, 2024 14:41:26 GMT -5
January was much colder than average. The first week was Canadian prairie cold even with a mean of -18.0C. Precipitation and sunshine were average.
Highest high: 4.7C (29th) Lowest high: -17.6C (4th) Highest low: 0.9C (10th) Lowest low: -23.3C (7th)
Anomalies from 91-20:
High: -3.3C Mean: -4.4C Low: -5.6C Precipitation: -5.6 mm (97%) Sunshine: +6h (115%)
|
|


 Lived:

 Residence:


