|
|
Post by Donar on Jan 27, 2020 16:32:29 GMT -5
^I would like to see the wikibox for Hiroshima 1945
|
|
|
|
Post by Babu on Jan 31, 2020 8:25:10 GMT -5
bruh  |
|
|
|
Post by jgtheone on Jan 31, 2020 9:06:45 GMT -5
^I would like to see the wikibox for Hiroshima 1945 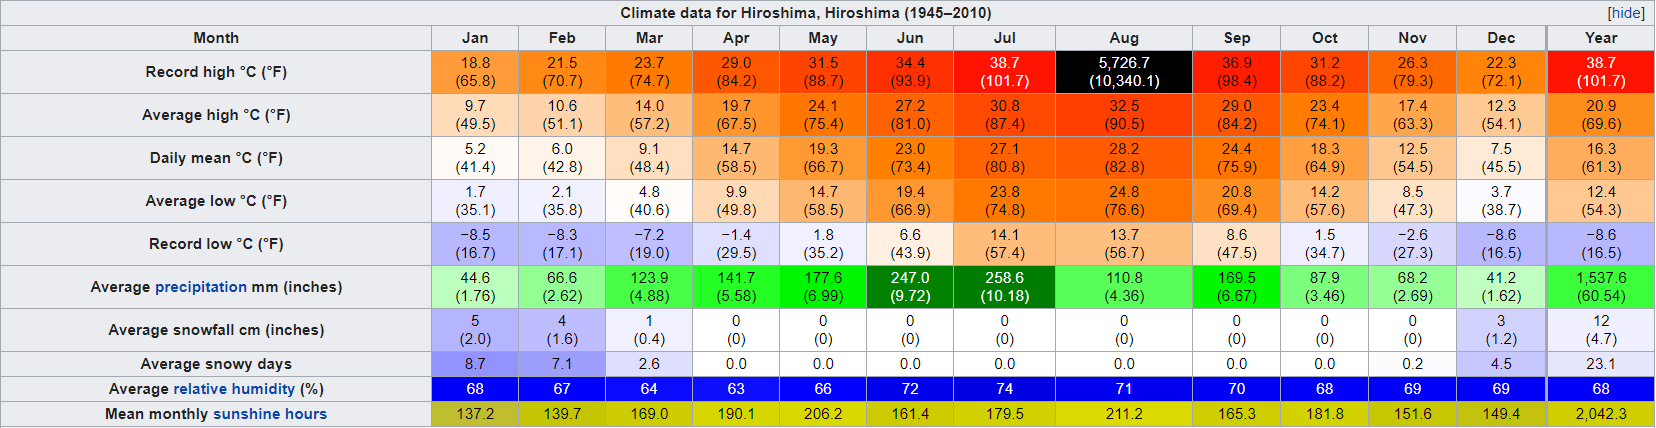 |
|
|
|
Post by trolik on Feb 1, 2020 16:45:03 GMT -5
 Right... who has vandalised the birmingham climate box lol |
|
|
|
Post by Ethereal on Feb 2, 2020 3:38:15 GMT -5
Is Batemans Bay really sunnier than Sydney? I mean, I have noticed that the south coast NSW would be getting crispy sunnier days in the summer whilst, at the same time, we would be bombarded with boring overcast days (following a heatwave). It kinda ticks me off, tbh. Though I would've thought Bega would be in the 8 hour zone, not Batemans Bay?  |
|
|
|
Post by Cadeau on Feb 2, 2020 8:43:55 GMT -5
16.2°C at the last hour update, if it happened 2 days earlier it could break the January record.
Funny how today's record high stand as 19.0°C set in 1957 but all-time in January struggled to pass 16.1°C. I'm sure hitting 17~18°C in January isn't too unrealistic.
|
|
|
|
Post by The Gior from Ipanema on Feb 3, 2020 8:29:32 GMT -5
In recent years, 70% of the months have been below average. So there is 30% of a month being below average. But somehow 6 of the past 7 Marches have been below average. What are the chances are of that happening? Well...
Doing the calculation (3/10)*(3/10)*(3/10)*(3/10)*(3/10)*(3/10)*(7/10) we get 0.0005103, or 0.05103%
So the chance of running into such a shitty string of Marches is less than 1/10th of a single percentage point. Pretty shit luck
|
|
|
|
Post by Babu on Feb 4, 2020 5:50:04 GMT -5
In Stockholm, January 2020 was 0.8'C warmer than May 1867.
|
|
|
|
Post by Speagles84 on Feb 4, 2020 5:57:30 GMT -5
In Stockholm, January 2020 was 0.8'C warmer than May 1867. Along those lines.... tHeRe Is NoThInG wRoNg WiTh ThE cLiMaTe.  |
|
|
|
Post by Fägler on Feb 4, 2020 17:41:29 GMT -5
Babu That's ridiculous. Both of those months. Stockholm doesn't have that much lag. nei 's post (http://cdweather.boards.net/post/115288) made me look at those hprcc maps a bit. March 2012: Never forget. Largest deviation I have seen, personally. And so much of the country was affected.  February 2019: This was most intense in rural areas, but look at the scale on the bottom! -25F departures for an entire month.  February 2015 was another cold one especially in the eastern Great Lakes. And extremely warm out west. 
|
|
|
|
Post by nei on Feb 4, 2020 18:33:38 GMT -5
Amherst was -15.1°F / -8.4°C in Feb 2015 from the monthly normal; biggest deviation on record |
|
|
|
Post by Steelernation on Feb 5, 2020 18:02:20 GMT -5
From the recent shoutbox discussion about biggest anomalies.
Here are the anomalies for Rochester’s record months. Warmest on left, coldest on right.
Jan: +12.8 (1932) and -10.0 (1918)
Feb: +9.1 (2017) and -14.2 (2015)
Mar: +13.0 (2012) and -13.3 (1885)
Apr: +6.3 (1878) and -10.3 (1874)
May: +7.6 (2018) and -7.9 (1967)
Jun: +6.8 (1949) and -5.3 (1881)
July: +7.0 (1921) and -5.4 (1884)
Aug: +6.6 (2016) and -4.2 (1927)
Sep: +9.8 (1881) and -5.2 (1918)
Oct: +8.9 (1900) and -6.9 (1925)
Nov: +8.6 (1931) and -9.8 (1873)
Dec: +12.2 (2015) and -12.9 (1989)
Pathetic that April has the lowest positive deviation.
Here are all the months with a +/- 10 f deviation, in order from greatest to least.
1. -14.2 (February 2015)
2. -13.8 (February 1934)
3. -13.3 (March 1885)
4. 13.0 (March 2012)
5. -12.9 (December 1989)
6. 12.8 (January 1932)
7. -12.7 (February 1979)
8. -12.4 (March 1872)
9. 12.2 (December 2015)
10. -12.0 (February 1875)
11. -11.9 (February 1885)
12. -11.9 (March 1960)
13. 11.8 (January 1880)
14. 10.8 (January 1933)
15. 10.7 (January 2006)
16. -10.5 (December 1876)
17. -10.3 (April 1874)
18. -10.2 (February 1978)
19. -10.1 (December 1872)
20. -10.0 (February 1904)
21. -10.0 (January 1918)
That’s 21 months. 15 negative, 6 positive.
7 February (0 positive, 7 negative)
5 January (4 positive, 1 negative)
4 December (1 positive, 3 negative)
4 March (1 positive, 3 negative)
1 April (0 positive, 1 negative)
February seems the month post prone to extreme cold snaps and large negative anomalies, January more prone to warm spells and positive anomalies. Winter and early spring definitely the mist variable time of year.
|
|
|
|
Post by Ethereal on Feb 6, 2020 4:59:18 GMT -5
This weekend is bullshit...  Even dry smoky air is more tolerable than massive deluge orgy... |
|
|
|
Post by chesternz on Feb 6, 2020 5:56:44 GMT -5
|
|
|
|
Post by Morningrise on Feb 6, 2020 9:55:16 GMT -5
This weekend is bullshit... Even dry smoky air is more tolerable than massive deluge orgy... Does this sort of thing happen every summer at some point or is this a notable event? Low 20s highs in February seems rather cold for Sydney compared to what I'd expect, even during a "cold snap". |
|
|
|
Post by Ethereal on Feb 7, 2020 0:09:09 GMT -5
This weekend is bullshit... Even dry smoky air is more tolerable than massive deluge orgy... Does this sort of thing happen every summer at some point or is this a notable event? Low 20s highs in February seems rather cold for Sydney compared to what I'd expect, even during a "cold snap". Heavy, persistent rainfall evens are more common in March or April (usually every other year, not every year). Last time February was this wet was exactly 10 years ago in 2010. But the horror rainfall in that February went for like a fortnight. I will never forget it. As I said, I'll always take smoke and dryness over these sort of laughable, 50mm+ rain per day, conditions. With that much rain and cloud, highs won't go above 22C. But that really isn't a problem. Just as long as highs don't go down to 17C... |
|
|
|
Post by Babu on Feb 7, 2020 14:04:34 GMT -5
Forecast high: 6'C
Actual high: -1'C
Other places like 100km away got like 4'C
Sundsvall's airport got a high of -0.7'C, whereas Brämön, an island 40km away, got the national high today of 7.6'C
|
|
|
|
Post by Strewthless on Feb 7, 2020 19:36:31 GMT -5
Storm heading in.
|
|
Deleted
Deleted Member
Posts: 0
|
Post by Deleted on Feb 7, 2020 19:43:27 GMT -5
Possible gusts up to 75mph in London on Sunday. The February wind speed record is 69mph (all time record 86mph), so this could be a dangerous storm.
|
|
Deleted
Deleted Member
Posts: 0
|
Post by Deleted on Feb 7, 2020 23:03:20 GMT -5
ENSO analogue years based on the prediction that this year will see El Nino by mid spring, and turn neutral towards summer.
1973
1995
1998
2010
2016
A real mixed bag as to what could happen.
|
|


 Residence: