|
|
Post by trolik on Aug 1, 2019 12:39:30 GMT -5
|
|
|
|
Post by Crunch41 on Aug 1, 2019 12:49:07 GMT -5
A! Lovely warm nights and sunshine. All rainfall must come from strong storms, it averages about 20mm per rainy day. A bit too much lag for a proper Noël atmosphere, otherwise it's an A+. What is this? Is the thermometer underwater? 1 degree diurnals, barely any rainy days, and October is warmer than July? It's a more extreme San Francisco.
|
|
|
|
Post by urania93 on Aug 1, 2019 13:02:45 GMT -5
The page in Italian (not so updated, but anyway) reports this instead:  ( link) |
|
Deleted
Deleted Member
Posts: 0
|
Post by Deleted on Aug 2, 2019 0:29:42 GMT -5
Just found today:  |
|
|
|
Post by Babu on Aug 2, 2019 6:25:07 GMT -5
Just found today:  What's wrong with it? |
|
|
|
Post by trolik on Aug 2, 2019 13:46:51 GMT -5
there's nothing wrong with it but so many tables tf
|
|
|
|
Post by Babu on Aug 2, 2019 14:13:23 GMT -5
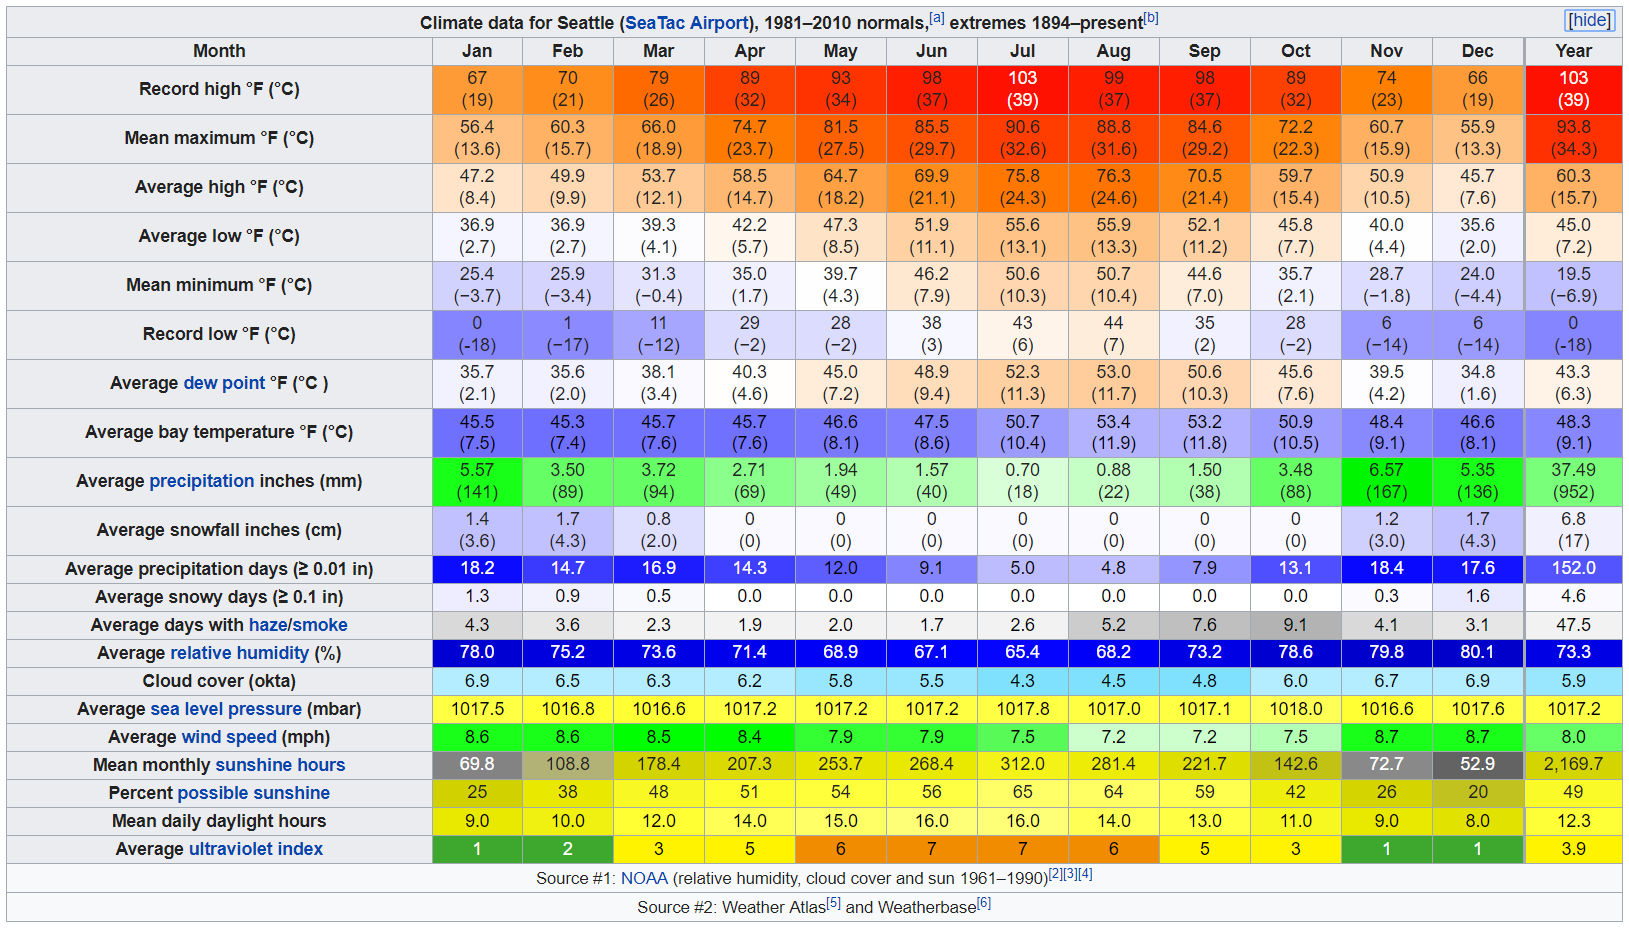
there's nothing wrong with it but so many tables tf The Seattle SeaTac weatherbox is the template, showcase, or flagship if you will, for weatherboxes. It has all the features available to the weatherbox. |
|
Deleted
Deleted Member
Posts: 0
|
Post by Deleted on Aug 2, 2019 15:11:05 GMT -5
there's nothing wrong with it but so many tables tf The Seattle SeaTac weatherbox is the template, showcase, or flagship if you will, for weatherboxes. It has all the features available to the weatherbox. It has more than "all the features available to the weatherbox". It involves a lot of additions that were coded manually. Also, most of the extra additions are pretty stupid and useless. |
|
|
|
Post by Crunch41 on Oct 9, 2019 19:28:00 GMT -5
|
|
|
|
Post by Crunch41 on Jun 5, 2020 19:35:29 GMT -5
The weather forecasters really want it to snow here.  |
|
|
|
Post by omegaraptor on Jun 5, 2020 19:53:31 GMT -5
 Hilts Slash Disposal very close to here and at 2920' averages 43/23 in January and 86/50 in July, and this box is supposed to be at 4300'. Complete BS. |
|
|
|
Post by Crunch41 on Jun 5, 2020 20:21:33 GMT -5
 Hilts Slash Disposal very close to here and at 2920' averages 43/23 in January and 86/50 in July, and this box is supposed to be at 4300'. Complete BS. The lower elevation place could be colder in winter if there was an inversion, but not in summer. |
|
|
|
Post by shalop on Jun 5, 2020 20:35:42 GMT -5
|
|
|
|
Post by Crunch41 on Jun 6, 2020 16:11:05 GMT -5
Wow, that is even worse. I took a screenshot.
|
|
|
|
Post by Speagles84 on Jun 11, 2020 7:03:19 GMT -5
This is one of the worst I've ever seen 100" of annual rain in Nashville? LMFAO come on. Polar vortex causing the average winter temperatures to drop to colder in November than February hahahahah god  |
|
|
|
Post by Benfxmth on Jun 12, 2020 7:32:24 GMT -5
This is one of the worst I've ever seen 100" of annual rain in Nashville? LMFAO come on. Polar vortex causing the average winter temperatures to drop to colder in November than February hahahahah god  Ahahaha I guess it was Sun Belt-lover who added that bullshit climate box. I removed it. |
|
|
|
Post by knot on Jun 13, 2020 6:25:58 GMT -5
This is one of the worst I've ever seen 100" of annual rain in Nashville? LMFAO come on. Polar vortex causing the average winter temperatures to drop to colder in November than February hahahahah god  Gotta love that description. I wonder who's the botev behind it… |
|
|
|
Post by Benfxmth on Jun 13, 2020 6:33:40 GMT -5
This is one of the worst I've ever seen 100" of annual rain in Nashville? LMFAO come on. Polar vortex causing the average winter temperatures to drop to colder in November than February hahahahah god  Gotta love that description. I wonder who's the botev behind it… I suspect it was Sun Belt-lover who added it: en.wikipedia.org/w/index.php?title=Nashville,_Tennessee&oldid=961023491 |
|
|
|
Post by Benfxmth on Jun 14, 2020 13:36:07 GMT -5
Ahahaha I just noticed that some fucking added maded up stats for Rome:  |
|
|
|
Post by Crunch41 on Jul 4, 2020 14:41:34 GMT -5
I was looking through Ethiopia and found this box. They used reliable-sounding sources, but the lows don't make sense.
 Source: en.wikipedia.org/wiki/Bahir_DarThe source for the record lows has this, from archive.org. The main site (ethiomet.gov.et) does not load. Mean RF = rainfall, mm  |
|