|
|
Post by Morningrise on Aug 4, 2020 8:23:44 GMT -5
The first three weeks of July were among the mildest and most stable summer weather I’ve ever experienced here, with only a 3C difference between average & record low, and 5C between average and record high. It was also on track to be wetter than average, just like June. Then the last week of the month came and ended up bringing some a bunch of variability into the month, including both our hottest and coldest highs and lows, as well as the end of the rain. It ended up being a slightly warmer and drier than average month. Sunshine was probably around average, and there weren’t really any remarkable thunderstorms, it’s been a fairly quiet storm season this year. Average high: 25.5C (normal: 25.3C) Average low: 12.4C (normal: 11.6C) Mean temperature: 19.0C (normal: 18.5C) Warmest high: 32.8C (July 29th) Warmest low: 17.9C (July 23rd) Coldest high: 20.0C (July 25th) Coldest low: 8.0C (July 27th) Warmest mean: 25.0C (July 29th) Coldest mean: 15.8C (July 25th) Precipitation: 52.1mm (normal: 60.3mm) Precipitation days: 14 (normal: 11)  |
|
|
|
Post by segfault1361 on Aug 4, 2020 19:42:20 GMT -5
A ridiculously hot July in Toronto all around.
Average High: 30.4C
Average Low: 19.5C
Maximum High: 35.5C (July 2)
Minimum Low: 15.3C (July 21)
5 hottest days by daytime high, with low as tiebreaker:
1. 35.5C (July 2)
2. 34.6C (July 8)
3. 34.4C (July 9)
4. 34.0C (July 7)
5. 34.0C (July 5)
5 coolest days by lowest daytime high:
1. 25.3C (July 13)
2. 25.6C (July 16)
3. 26.2C (July 21)
4. 26.7C (July 22)
5. 26.8C (July 14)
Total Precipitation: 67.6mm
Number of days with Rain: 9 days
Rainiest day: 21.0mm (July 11)
|
|
Deleted
Deleted Member
Posts: 0
|
Post by Deleted on Aug 6, 2020 7:01:40 GMT -5
|
|
|
|
Post by Babu on Aug 6, 2020 12:52:15 GMT -5
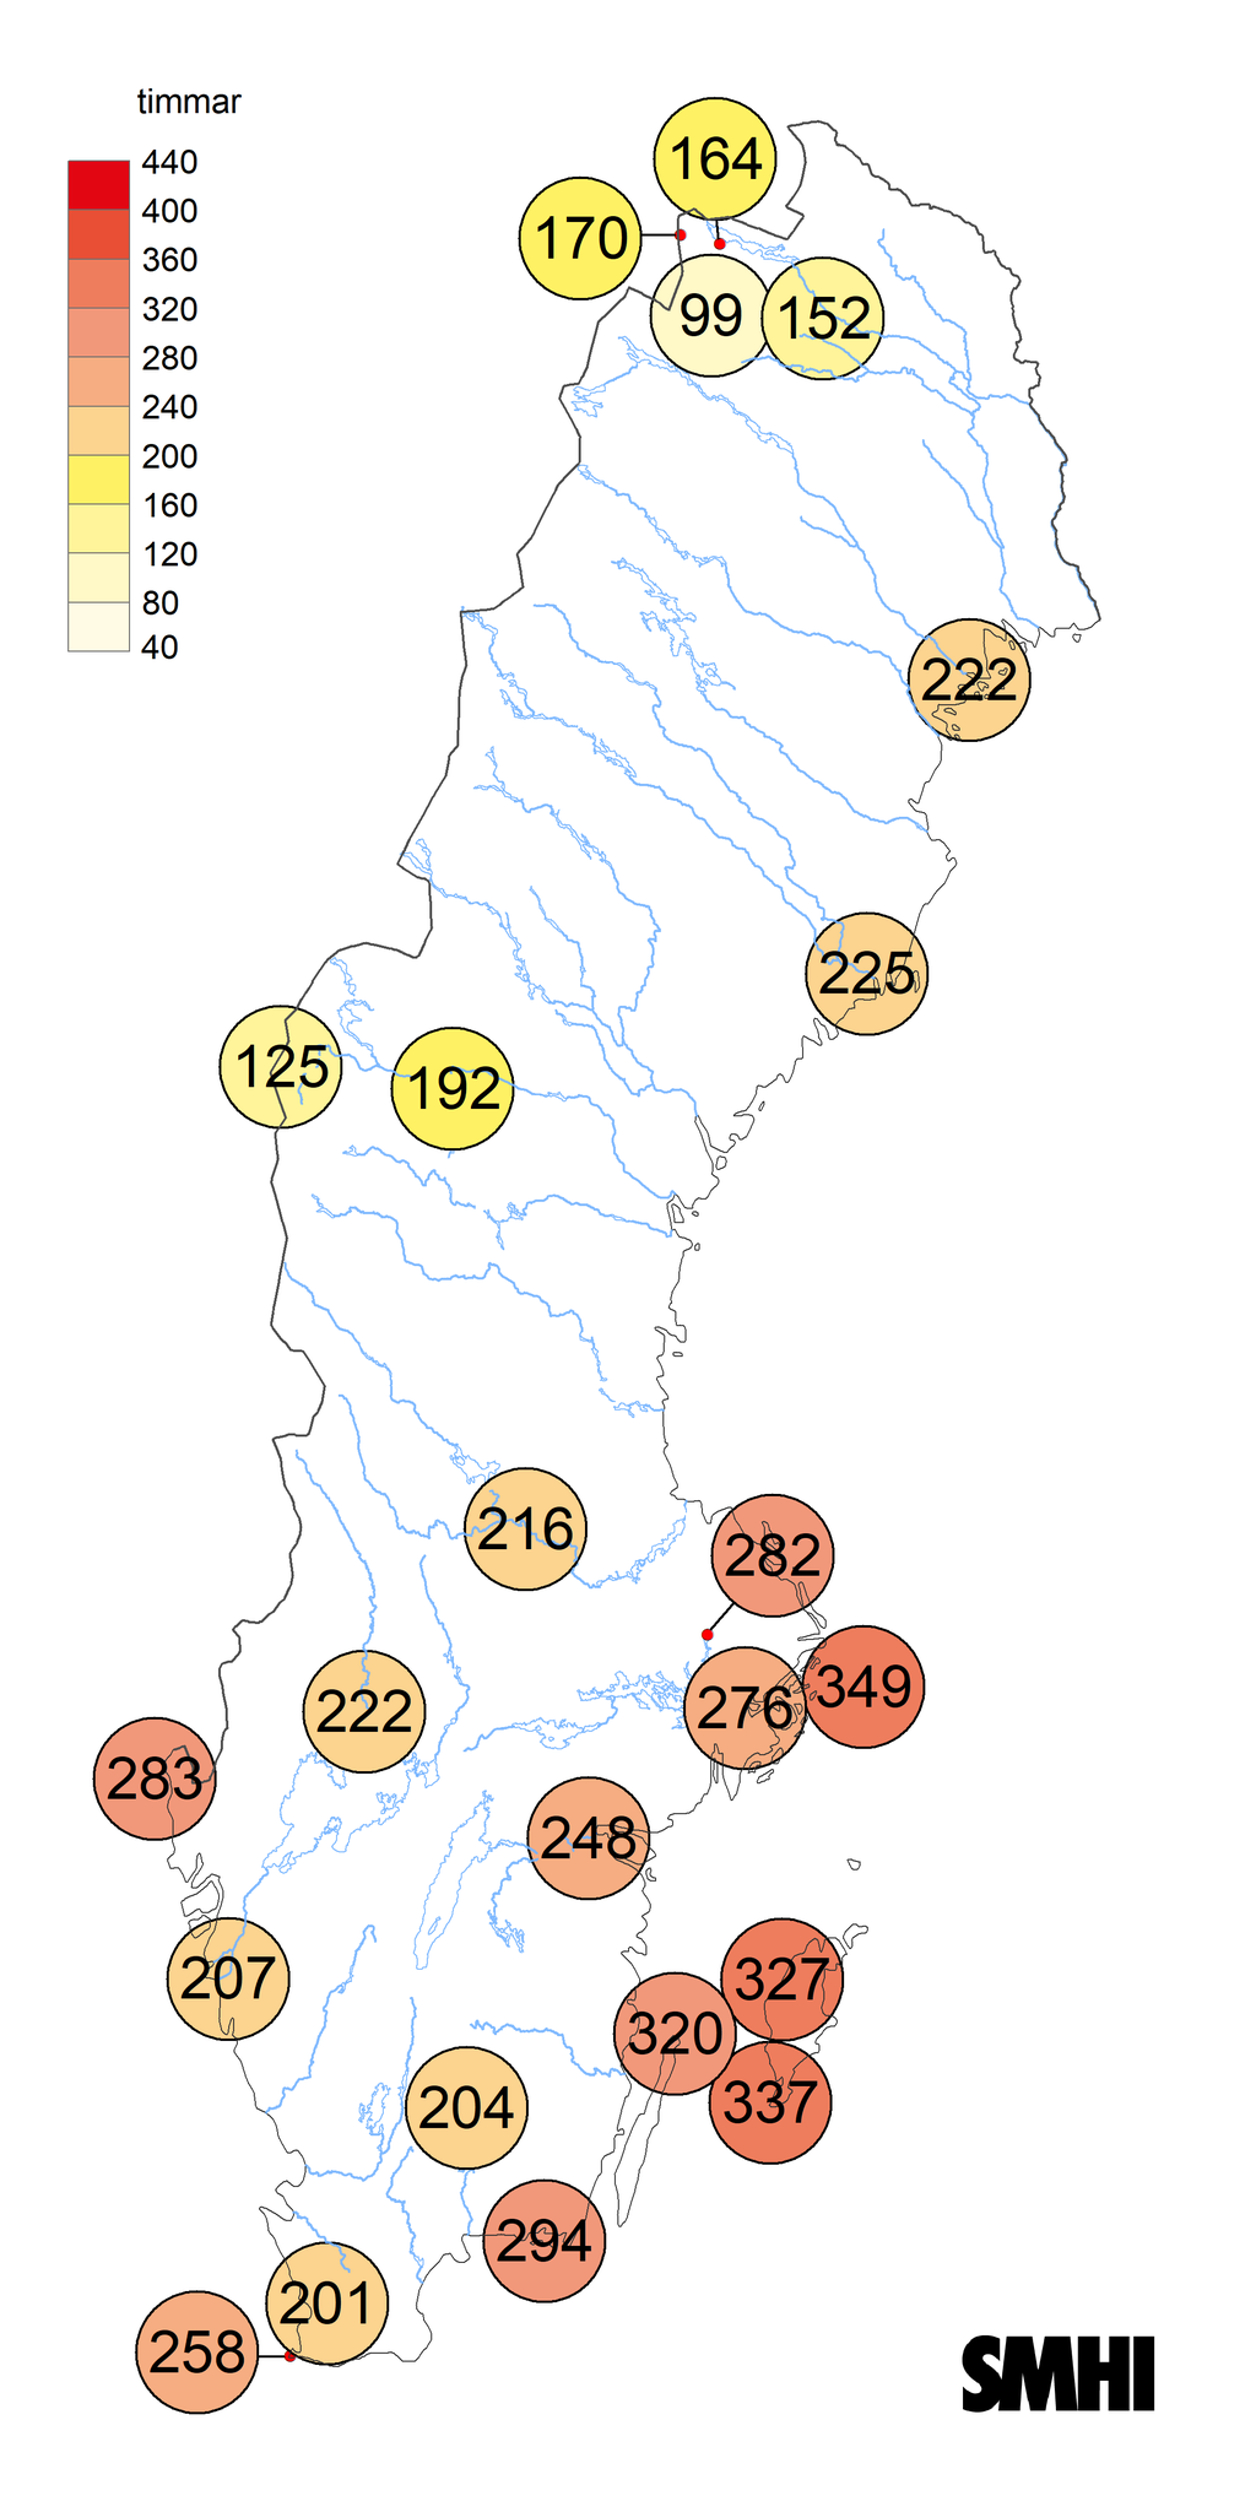
SMHI summary Warmest in the SE. Lots of places in the middle latitudes, especially towards the west, had their coldest July in 30-70 years. No station was above the 1991-2020 mean.  Lots of stations had their top 3 cloudiest July ever. Average sunshine compared to the last 20 years in the Baltic sea in the SE though   |
|
|
|
Post by jgtheone on Aug 8, 2020 9:38:52 GMT -5
|
|
|
|
Post by Cadeau on Aug 14, 2020 9:54:01 GMT -5
Reykjavík, Iceland July 2020  - Copenhagen, Denmark July 2020  - Montréal, Québec, Canada July 2020  - San Francisco, CA, United States July 2020  *Note: One day of missing data - Honolulu, HI, United States July 2020  *Note: One day of missing data, estimated the value |
|
|
|
Post by Crunch41 on Aug 15, 2020 0:30:49 GMT -5
Phoenix, AZ July 2020 Summary Highest Temp 47.8°C Lowest Temp 24.4°C Minimum High 36.7°C Maximum Low 34.4°C Mean Temp 37.15°C Dep +1.6°C Total Rainfall 2.54 mm Departure -22.86 mm This July was literally one for the record books. It was our hottest July ever and hottest month ever, beating July 2009 and August 2011 by 0.35°C. It also had the latest monsoon start in the 20 years I've lived here, at July 22nd; 16 days later than average! August is averaging even hotter so far with zero rainfall. Any sign of a weather pattern changing to below average or wet?
NOWData has two days with measurable rainfall (0.18") since April 1st, and a few days with a trace. Wow. Even more of a desert than normal.
|
|
|
|
Post by firebird1988 on Aug 15, 2020 5:01:34 GMT -5
Phoenix, AZ July 2020 Summary Highest Temp 47.8°C Lowest Temp 24.4°C Minimum High 36.7°C Maximum Low 34.4°C Mean Temp 37.15°C Dep +1.6°C Total Rainfall 2.54 mm Departure -22.86 mm This July was literally one for the record books. It was our hottest July ever and hottest month ever, beating July 2009 and August 2011 by 0.35°C. It also had the latest monsoon start in the 20 years I've lived here, at July 22nd; 16 days later than average! August is averaging even hotter so far with zero rainfall. Any sign of a weather pattern changing to below average or wet?
NOWData has two days with measurable rainfall (0.18") since April 1st, and a few days with a trace. Wow. Even more of a desert than normal.
No change in temps, continued above average for the foreseeable future, but they think more humidity and possible storm chances by the weekend |
|
|
|
Post by Benfxmth on Aug 15, 2020 10:50:34 GMT -5
I'm reposting with precipitation data; I realized that Ogimet seems to be bullshit when it comes to precipitation data as it occasionally double reports rainfall amounts (like when it reported 40 mm of rain on the 4th when it actually was 20 mm; though they get the temperatures right), and GSOD seems to be much more accurate for precipitation data. Here are the weather boxes:   |
|
|
|
Post by Babu on Aug 16, 2020 4:44:21 GMT -5
I'm reposting with precipitation data; I realized that Ogimet seems to be bullshit when it comes to precipitation data as it occasionally double reports rainfall amounts (like when it reported 40 mm of rain on the 4th when it actually was 20 mm; though they get the temperatures right), and GSOD seems to be much more accurate for precipitation data. Here are the weather boxes:   It could be to do with what day break cutoff point you're using for ogimet. 18:00 is what you should be using at least for the central european time countries I've looked at. |
|
|
|
Post by Cadeau on Aug 16, 2020 9:53:59 GMT -5
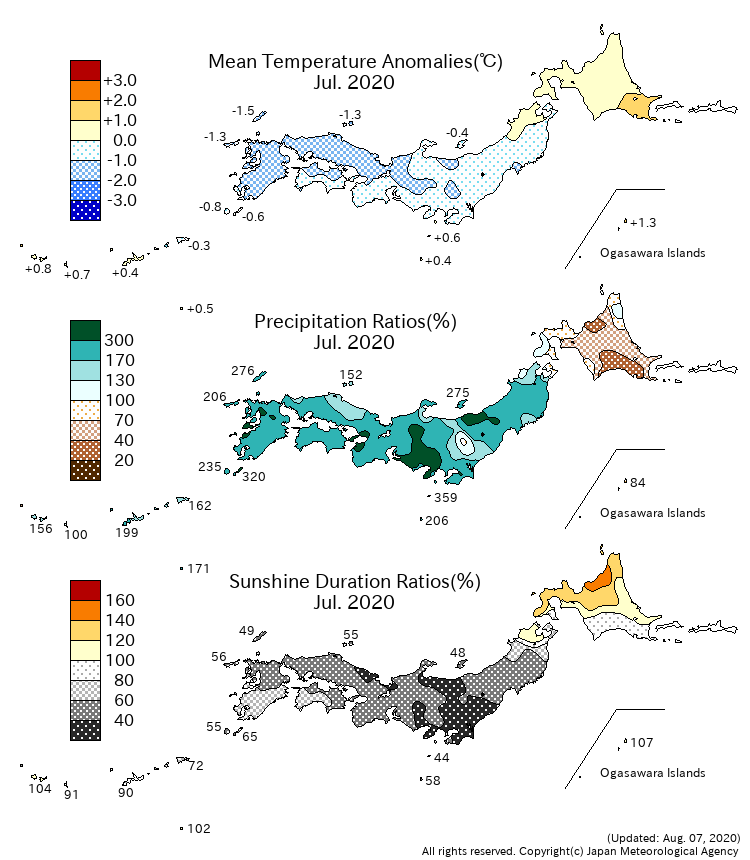
▼ <Monthly Climate Anomaly over Japan>

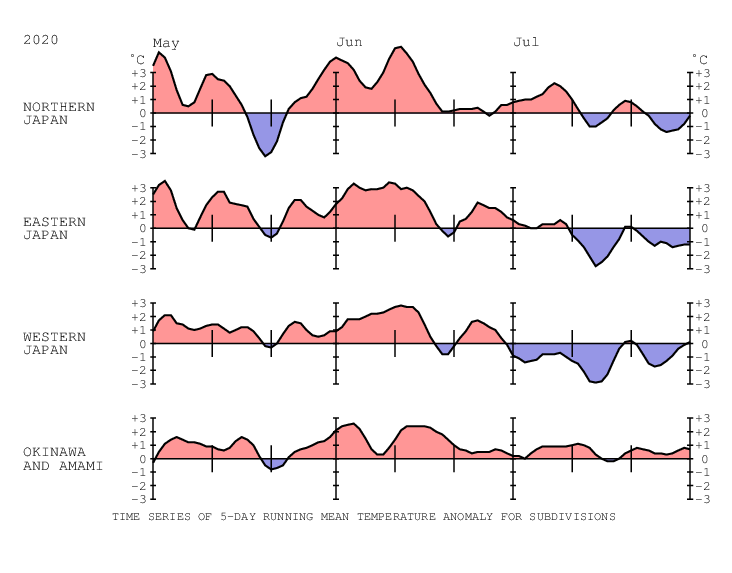
▼ <Time Series of Temperature Anomaly>

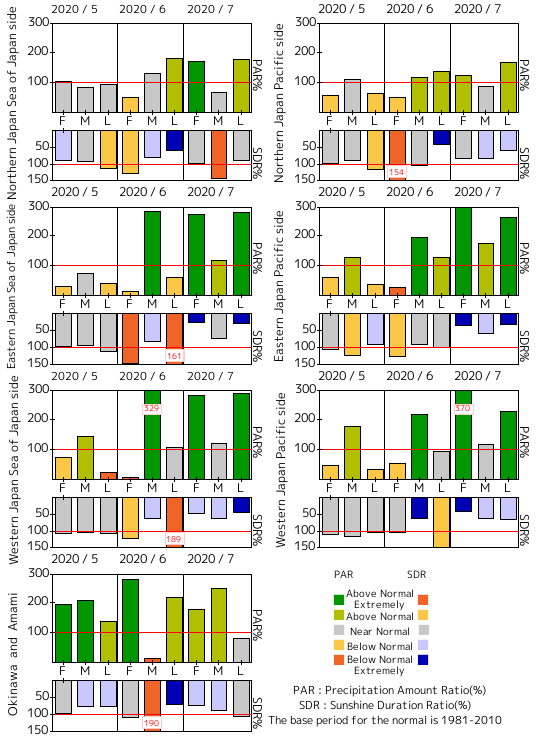
▼ <Time Series of 10days Precipitation Amount Ratio and Sunshine Duration Ratio>

▼ <10-day Mean Sea Level Pressure>
▼ <10-day Mean 850hPa Temperature>
▼ <10-day Mean 500hPa GeoPotential Height>
▼ <10-day Mean Outgoing Longwave Radiation>
|
|