|
|
Post by Crunch41 on Jan 10, 2021 21:17:12 GMT -5
December was mild at +5.2F/+2.9C, wetter and less snowy than average. Most of the rain came on the 11th-12th which saw 1.56"/39.6mm with a bit of snow on the northwest side, but the airport is to the southeast. The month started mild, reaching 56F/13C on the 10th, and after the rain it was again dry and mild, with the 57F/14C on the 23rd. The next two days were the coldest of the month, but not unusual for winter, with highs in the 20s and a steady wind. Through Christmas, the winter had a total of 0.6" snowfall, even though 14 days recorded a trace or more. On the 29th-30th, most of the month's snow fell and ended the snow "drought". Overall, too mild, with a lot of cloudy dry days. The snow at the end was the only part I liked. For 2020 as a whole, it was a warm year with 9 months above average. Tied for 6th warmest, below the record 51.9 in 1931 and 2012. Rainfall was above normal, mostly from August, and snowfall below. The 8th wettest year, but that was due to luck. A storm in August stalled right over the airport giving them 4.8" of rain while other areas were under 1". [ Link to post in seasonal thread]. After a very wet 2018 and 2019, it felt like a normal year again. From the NWS, Lake Michigan had record high water levels from January to August 2020, with data back to the early 1900s. However, [ this site] has different data and 2020 was not a record. Yearly summary from the NWS: Average temperature: 50.6 F / 10.3 C (+2.7F / +1.5C)
Highest: 95F/35C, normal is also 95
Lowest: -3F/-19C, warmer than the normal of -13F/-25C
Days reaching 90F - 8 (+1) Highs 32F or below - 24 (-28) Lows 32F or below - 115 (-11) Lows 0F or below - 1 (-6) The largest deviation was January, 7.9F/4.4C above normal. With all the cold months warmer than average, there were fewer cold days this year.
Precipitation: 41.01" / 1042mm (+6.25" / 159mm)
I don't know why the total does not match my box since it does not give monthly totals. Despite the rainfall, fewer wet days than normal. Wettest compared to average was August. Days with 0.01" 112 (-15) Days with 0.10" 73 (+4)
Days with 1.00" 10 (+3) Snowfall: 27.5" / 69.3cm (-19.4" / -49.3cm) Days with 1" snowfall 10 (-3) No months had more snowfall than average. May saw a trace, more than most years, but the average is 0.1".
Heating degree days 6092 (-802) Cooling degree days 938 (+297) An unusual Köppen Cfa year since the coldest month was above -3C. The 8th year since 1871. Still colder than some stations in the nordics this year at much higher latitude  |
|
|
|
Post by Moron on Jan 12, 2021 4:25:57 GMT -5
A very sunny, hot and dry December. It also featured the coldest summer morning in the stations history (since '93). We had 2 days below 10hrs of sunshine the entire month  . Also had 3 days of 40C+ in a row at Perth Metro, close to the record breaking spell of 4x 40C days in a row in December 2019 (which was the 3rd recorded instance after Feb 1930-something and Feb 2016). Perth Metro: High Max: 41.1C (24th) Mean Max: 31.7C (+2.4C) Low Max: 23.1C (13th) Monthly Anomaly: +1.45C High Min: 24.1C (30th) Mean Min: 16.9C (+0.5C) Low Min: 6.6C (1st) Rain: 4.4mm (42% of average 10.4mm) Rain Days: 3 (-0.5) Sun: 391.0 hours Sun hrs/day: 12.6hrs/day (+1.1 hrs/day)  Jandakot: High Max: 41.2C (24th) Mean Max: 31.6C (+2.4C) Low Max: 22.9C (1st) Monthly Anomaly: +1.9C High Min: 25.4C (30th) Mean Min: 16.2C (+1.4C) Low Min: 5.0C Rain: 2.2mm (21.1% of average 10.4mm) Rain Days: 3 (-0.4) Sun: 391.0 hours Sun hrs/day: 12.6hrs/day (+1.1hrs/day)  Annual Anomalies: Perth Metro: Highest Maximum: 42.7C Mean Maximum: 25.3C (+0.5C) Mean Minimum: 13.5C (+0.7C) Lowest Maximum: 3.4C Rainfall: 673.2mm (92.1% of average 730.9mm) Rain Days (>0.2mm): 112 (average 107.9 days) Sun Hours: 3166.9 Jandakot: Highest Maximum: 41.6C Mean Maximum: 25.1C (+0.5C) Mean Minimum: 12.7C (+1.2C) Lowest Maximum: 1.7C Rainfall: 665mm (86.7% of average 766.3mm) Rain Days (>0.2mm): 105 (average 106.6 days) Sun Hours: 3166.9 |
|
|
|
Post by jgtheone on Jan 12, 2021 4:56:23 GMT -5
|
|
|
|
Post by srfoskey on Jan 12, 2021 16:08:34 GMT -5
An unusual Köppen Cfa year since the coldest month was above -3C. The 8th year since 1871. Milwaukee is a subtropical paradise confirmed. |
|
|
|
Post by Babu on Jan 16, 2021 6:55:55 GMT -5
I can't get over how Trondheim saw practically zero warming from Jan-May. It went straight from winter to high summer (if you can even call it winter). (Værnes airport)  And here's Kristiansand airport being constantly above the 75th percentile for highs, for the whole year, except for May and July. Looks so odd.  |
|
|
|
Post by Babu on Jan 18, 2021 3:42:06 GMT -5
I made weatherboxes for the two 100m ASL roadside traffic agency stations in Umeå municipality's inland, Brattby marked in blue and Långviksvallen marked in red. Map: Brattby 2020:  Långviksvallen 2020:  Långviksvallen is located right next to the Tavelsjö lake (on the SW side. I used to live on the NE side in Tavelsjö community), which makes it a particularly interesting station for me. However, when comparing it to Brattby, its average highs seem quite suspect. This is what the station placement looks like. It's quite far away from the road (at least far enough to not really be affected by it considering the small size of the road, since the distance from the road is about the same as the width of the road), so the only problem is that it's surrounded by really dense vegetation. I wouldn't have thought it to make that much of a difference, but looking at the stats they seem a bit too warm during the days. in comparison, here's the Brattby station which is more openly placed, but a little bit closer to the road, and half of the ground right underneath the station is gravel instead of grass. The Brattby station seems to be placed about half a meter higher off the ground than the Långviksvallen station so maybe that's a part of the reason (They have the same means but different diurnal ranges). Either way, these stations should be representative of the inland suburbs of Umeå when taken with a grain of salt, especially if you consider that you're almost always going to be within a couple meters from gravel or asphalt or dense vegetation anyway when living your day-to-day life. Also, some of the months had 1-2 days of missing data. I'm assuming this is the reason for the 5'C difference in maximum temperature in November. |
|
|
|
Post by Babu on Jan 18, 2021 4:43:38 GMT -5
Made one for the 50m ASL traffic agency station in Örnsköldsvik, the closest town to the south of Umeå about 100km away.  This is what the station placement looks like: The fence is directly to the south, and shaded by trees so it shouldn't matter. As evident from the image, the asphalt is shaded during the day as well, so it shouldn't really have any positive effect on temperature readings either. It should be a pretty good representation of non-uhi shade temperatures. Also located a valley, but not in the very bottom of it, so it should have a good balance between being a frost hollow and mild-hill or whatever you could call it. |
|
|
|
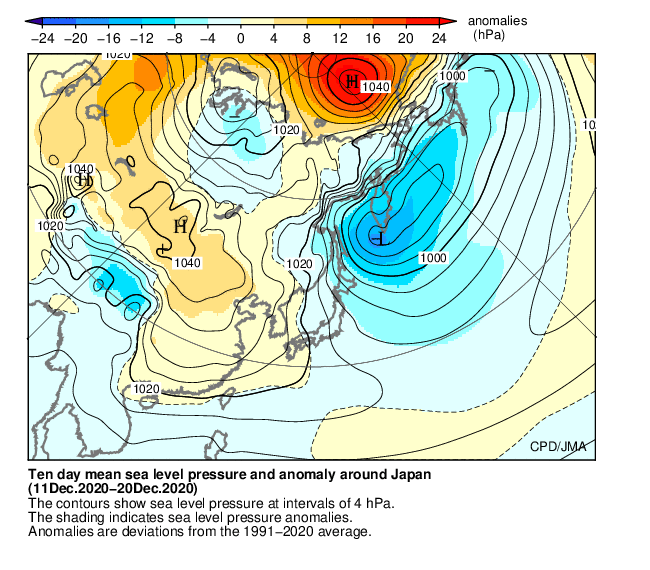
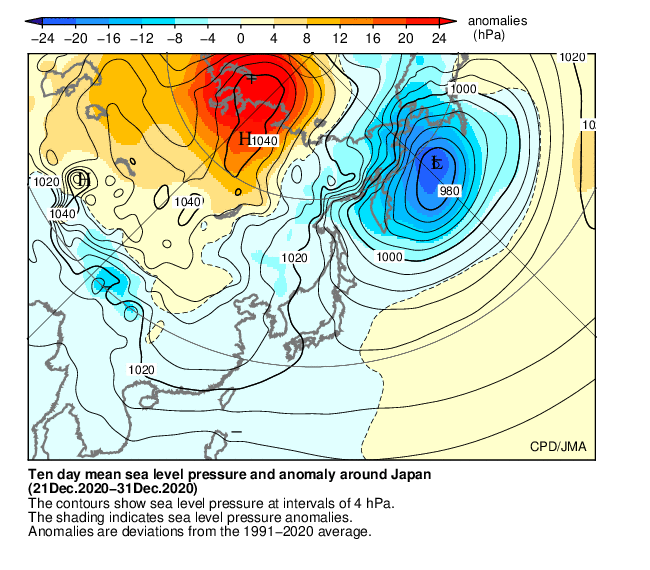
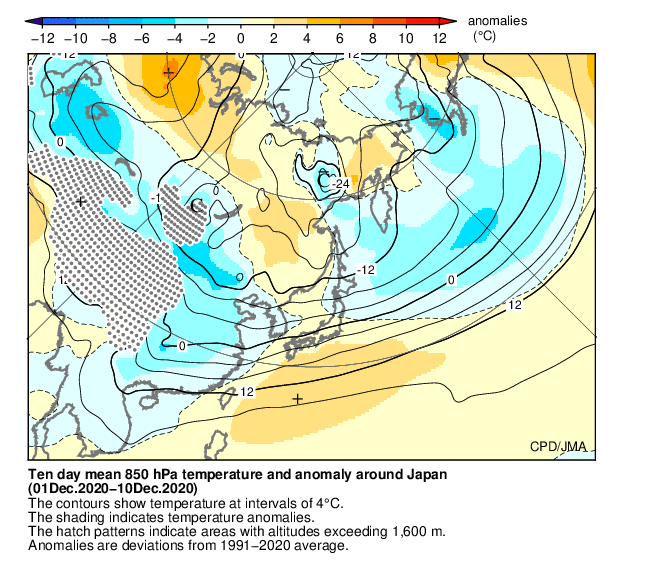
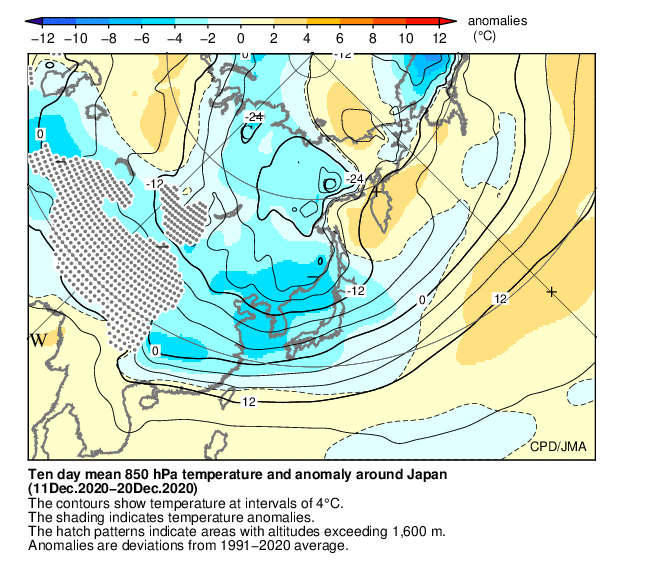
Post by Cadeau on Jan 21, 2021 9:17:02 GMT -5
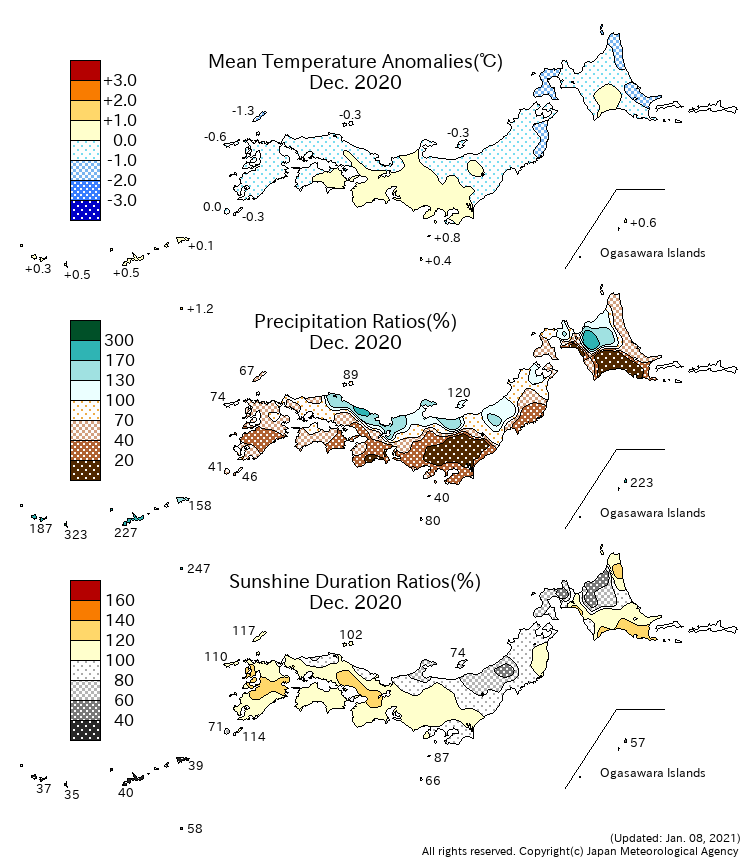
▼ <Monthly Climate Anomaly over Japan>
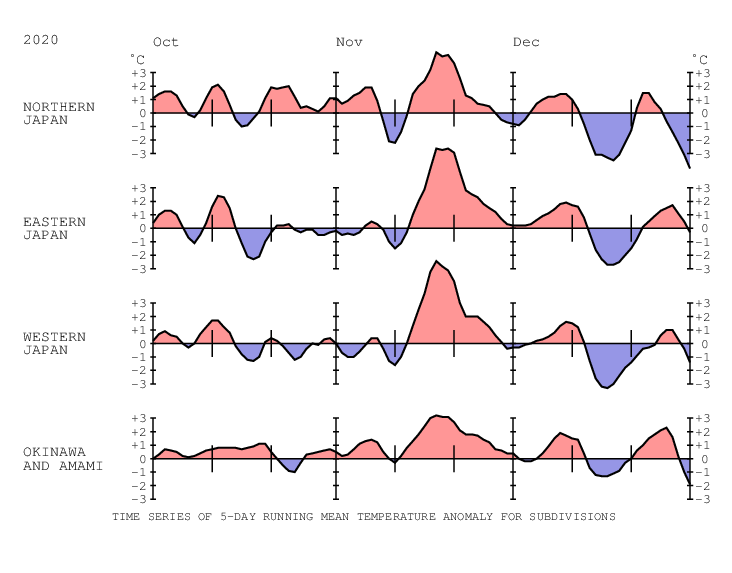
▼ <Time Series of Temperature Anomaly>
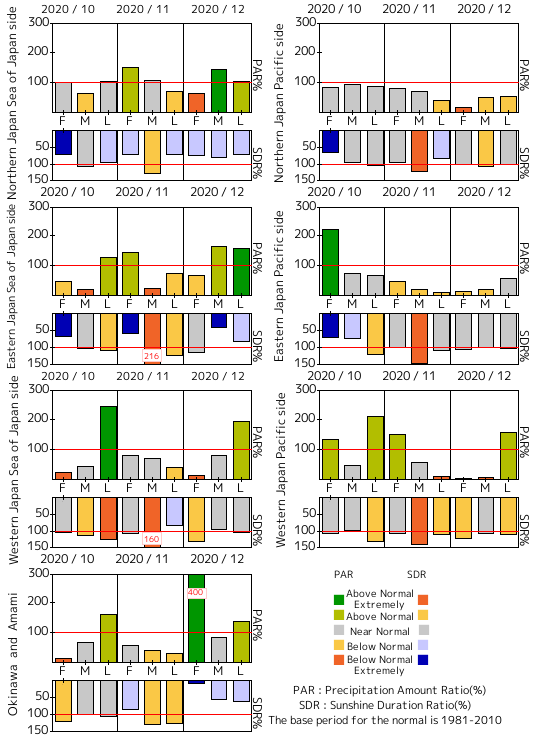
▼ <Time Series of 10days Precipitation Amount Ratio and Sunshine Duration Ratio>
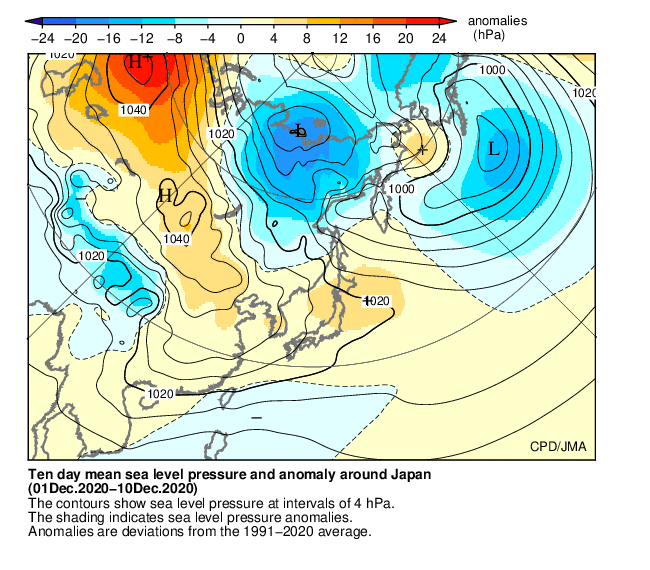
▼ <10-day Mean Sea Level Pressure>
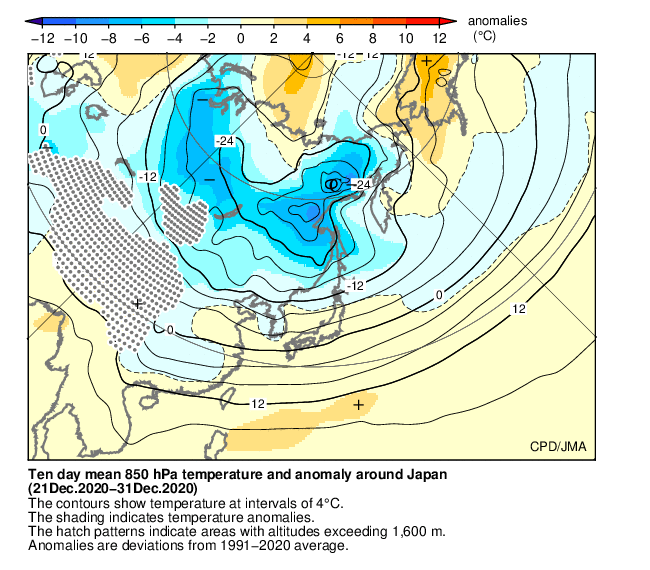
▼ <10-day Mean 850hPa Temperature>
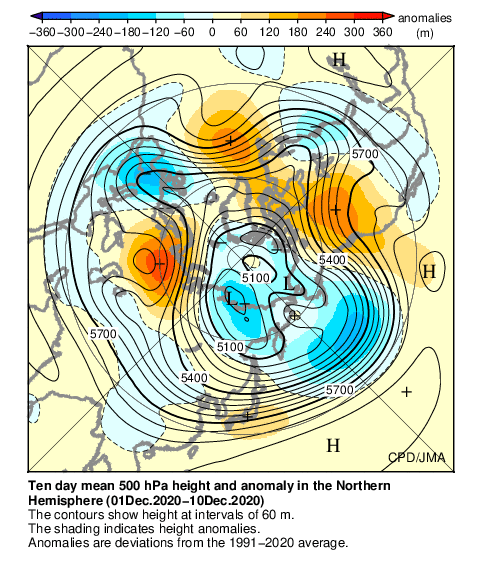
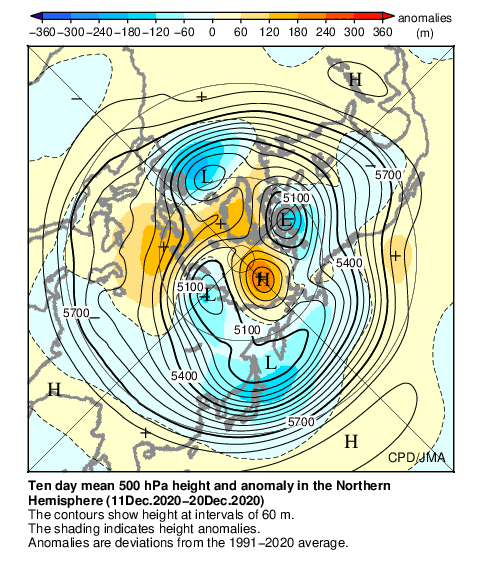
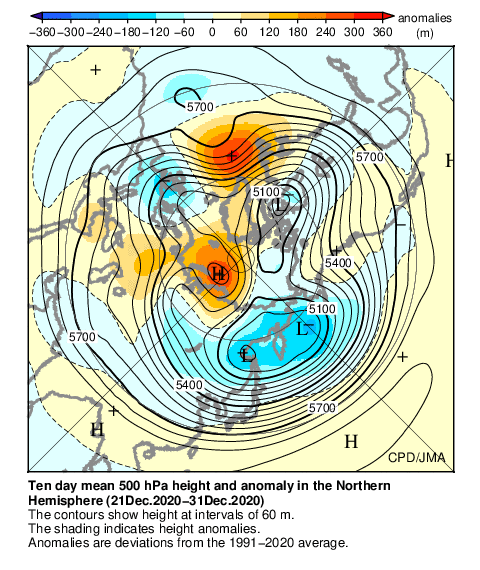
▼ <10-day Mean 500hPa GeoPotential Height>
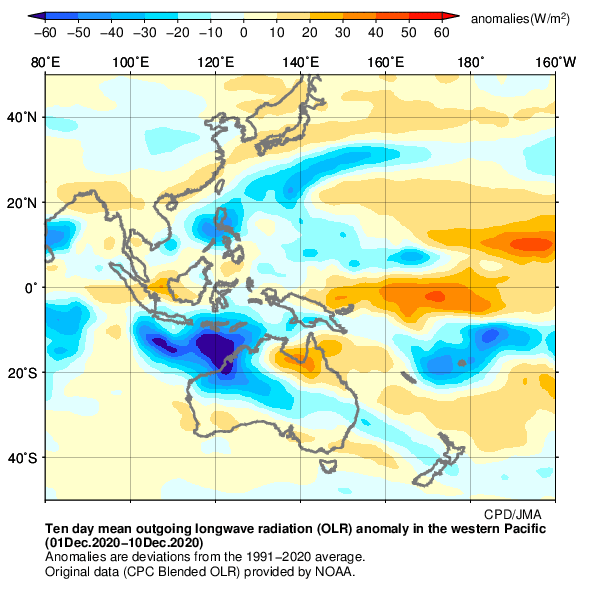
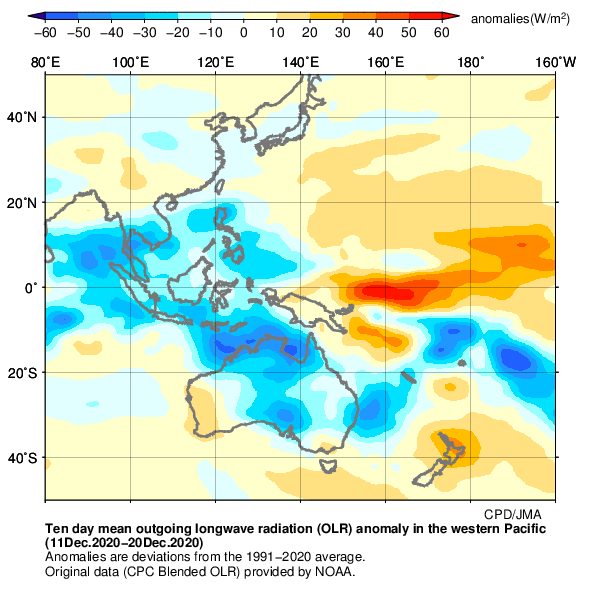
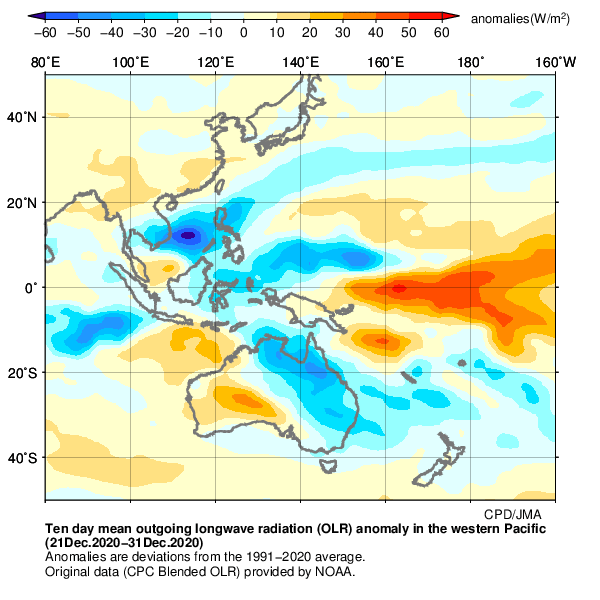
▼ <10-day Mean Outgoing Longwave Radiation>
|
|
|
|
Post by Cadeau on Jan 29, 2021 8:58:00 GMT -5
South Korea 2020 SummaryTime series anomaly and monthly rankings of national average temperature (since 1973 - total 48 years)  January: 1st(warmest)February: 3rdMarch: 2ndApril: 44thMay: 14thJune: 1st(warmest)July: 44thAugust: 6thSeptember: 29thOctober: 31stNovember: 10thDecember: 34thTime series anomaly and monthly rankings of national precipitation (since 1973 - total 48 years)  January: 2ndFebruary: 9thMarch: 41stApril: 43rdMay: 23rdJune: 15thJuly: 6thAugust: 6thSeptember: 13thOctober: 47th(driest; tied with 1990)November: 24thDecember: 45th
|
|
|
|
Post by Babu on Feb 1, 2021 6:19:45 GMT -5
Umeå Airport and Uni  Okay so official figures for precipitation are compiled now and October and especially December were way off in the previous weatherbox. Here's the updated data:  I'm pretty sure this was the wettest fall on record (October broke its previous all-time record by 20mm), and I'm pretty sure it's the wettest Sep-Jan ever period as well because Jan 2021 got over 100mm of precipitation for sure (incomplete data as of yet). The annual all-time record is 1024, so we were just 90mm off the record. |
|
|
|
Post by lab276 on Feb 11, 2021 4:20:09 GMT -5
Prague 2020  |
|
|
|
Post by Beercules on Feb 11, 2021 5:18:10 GMT -5
^^^ You live in Prague now?!
|
|
|
|
Post by lab276 on Feb 11, 2021 5:42:51 GMT -5
No, just interested. It's the old country.
|
|
|
|
Post by Ariete on Feb 19, 2021 13:17:30 GMT -5
Lol, noticed that I never did this. Warmest year on record. Now with ensoleillements!
|
|
|
|
Post by Moron on Feb 23, 2021 22:27:17 GMT -5
Wanted to see what SW WA's wettest climate was like in 2020. Yeah ew.  Rain days >1mm Jan 7 Feb 6 Mar 8 April 9 May 15 Jun 13 Jul 16 Aug 16 Sep 15 Oct 8 Nov 11 Dec 6 |
|


 . Also had 3 days of 40C+ in a row at Perth Metro, close to the record breaking spell of 4x 40C days in a row in December 2019 (which was the 3rd recorded instance after Feb 1930-something and Feb 2016).


 Lived:

 Residence:


