|
|
Post by srfoskey on Jul 1, 2020 21:33:28 GMT -5
Here are the normals for OKC and Raleigh updated thru June.  I never did the May differences, so here they are. Changes vs. 1981-2010 for OKC Avg max: +0.2F Avg mean: +0.1F Avg min: 0.0F Avg precip: +0.66" Avg snow: 0.0" Changes vs. 1961-1990 for OKC Avg max: +0.4F Avg mean: +0.6F Avg min: +0.9F Avg precip: +0.07" Avg snow: 0.0" Changes vs. 1981-2010 for Raleigh Avg max: +0.5F Avg mean: +1.1F Avg min: +1.5F Avg precip: +0.11" Avg snow: 0.0" Changes vs. 1961-1990 for Raleigh Avg max: +1.1F Avg mean: +1.8F Avg min: +2.5F Avg precip: -0.54" Avg snow: 0.0" I find it really strange how remarkably similar this year has been for OKC and Raleigh. They are virtually identical every month for temperature, and very similar elsewhere, despite being over 1000 miles apart! I mean the two cities do have similar climates, with OKC being a bit drier. They're on basically the same latitude, with OKC being slightly further south and higher in elevation, which is how the temperatures can be so similar. But the year 2020 itself has been less similar. |
|
|
|
Post by Beercules on Jul 1, 2020 21:38:31 GMT -5
The Flughafen Renmark data from 1995-2019, as close to the premise of this thread as possible. Die Flughafen was only opened in '95.  |
|
|
|
Post by Dean York (Old) on Jul 2, 2020 4:10:31 GMT -5
I find it really strange how remarkably similar this year has been for OKC and Raleigh. They are virtually identical every month for temperature, and very similar elsewhere, despite being over 1000 miles apart! I mean the two cities do have similar climates, with OKC being a bit drier. They're on basically the same latitude, with OKC being slightly further south and higher in elevation, which is how the temperatures can be so similar. But the year 2020 itself has been less similar. Maybe I'm just too used to European climates. The same latitude as me here will be completely different, particularly winter. |
|
Deleted
Deleted Member
Posts: 0
|
Post by Deleted on Jul 2, 2020 4:27:33 GMT -5
London June 1991-2020
Avg max: 21.6c
Avg min: 12.0c
Rainfall: 47.3mm
Rain days: 8.5
Sunshine: 196.6 hours
Warmer, wetter, more rain days and cloudier vs 81-10.
I will post a wiki box with more information when I am back home.
|
|
|
|
Post by jgtheone on Jul 2, 2020 5:04:21 GMT -5
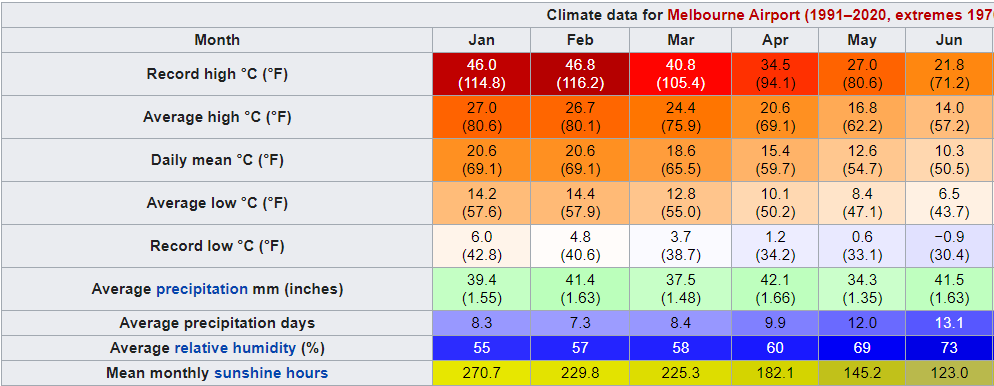
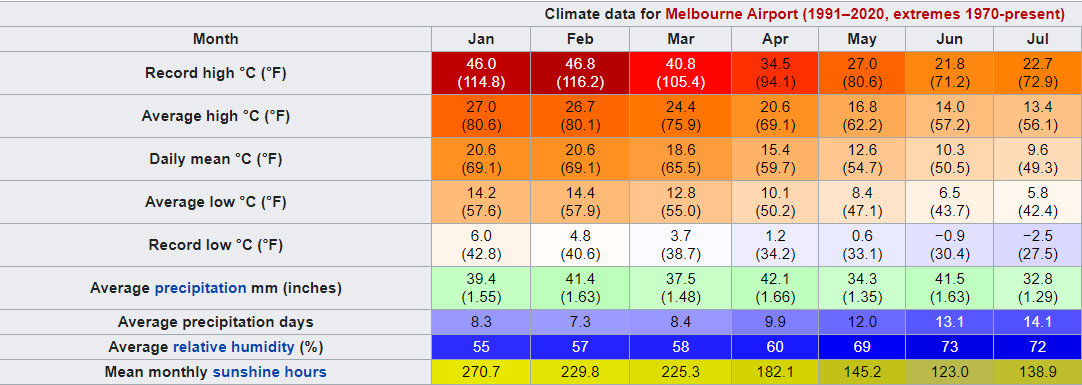
So far (the cut off part says extremes 1970-present):  |
|
|
|
Post by Crunch41 on Jul 2, 2020 21:28:13 GMT -5
I noticed last time that the NOWData averages and the official normals didn't match. Here is NOWData minus the official normal. The average temperatures are higher in every month, snowfall is higher, the rest is the same.  This next box compares the 1991-2020 average to the 1981-2010 average, both are from NOWData without the NWS adjustments. Record high and low value is the 1991-2020 extreme minus the full POR. A value of 0 means the record was broken in 1991-2020. The numbers in the Year column are based on six months. So far it's getting warmer and wetter. April is the only colder month. The biggest changes are January warmth and June rainfall.
 The averages:
One day in June recorded 0.4 inches of snow but the low that day was in the 60s so it must be hail. It doesn't snow in June.
|
|
Deleted
Deleted Member
Posts: 0
|
Post by Deleted on Jul 16, 2020 7:40:58 GMT -5
A bit delayed, but here are the first 6 months of 1991-2020 averages.  |
|
|
|
Post by jgtheone on Aug 1, 2020 10:39:40 GMT -5
Update  |
|
|
|
Post by Steelernation on Aug 1, 2020 13:50:28 GMT -5
July got warmer and wetter  Mean Max: 92.1 f Mean Min: 50.7 f Differences from 1981-2010 Average high: +0.7 f Average low: +0.9 f Mean: +0.8 f Precipitation: +0.23”, 7% Record high: 1993, 2011 Record low: 2001 |
|
|
|
Post by Wildcat on Aug 1, 2020 16:49:46 GMT -5
|
|
Deleted
Deleted Member
Posts: 0
|
Post by Deleted on Aug 6, 2020 7:00:40 GMT -5
|
|
|
|
Post by srfoskey on Aug 12, 2020 23:25:39 GMT -5
Here're the updates thru July. I'll post the trends from past averaging periods later.  |
|
|
|
Post by kronan on Aug 13, 2020 12:30:56 GMT -5
|
|
|
|
Post by Steelernation on Aug 17, 2020 21:03:12 GMT -5
Here’s Fort Collins  Temp changes from 81-10 January: +0.8 f, February: +0.3 fMarch: +1.2 fApril: +0.3 fMay: -0.1 fJune: +1.0 fJuly: +0.8 fPrecipitation changes from 81-10
January: -0.01”, -2%February: +0.07”, +18%March: -0.32”, -20%April: +0.04”, +2%May: +0.29”, +12%June: -0.28”, -13%July: -0.08”, -5%Snow changes from 81-10January: -1.2”, -15%February: +0.6”, +9%March: -3.2”, -25%April: 0”, 0% May: +0.8”, +114% |
|
|
|
Post by srfoskey on Aug 20, 2020 17:16:36 GMT -5
Here're the trends for every month from January to July. I figured it was easier to do it this way. 61-91 means 1991-2020 averages minus 1961-1990 averages, and 81-91 is the same but with 1981-2010 instead of 1961-1990. I may add a comparison with the 1891-1920 averages at the end of the year.
 |
|
|
|
Post by Ariete on Aug 31, 2020 14:22:59 GMT -5
Difference from 81-10:
High: +1.0C
Mean: +1.0C
Low: +1.0C
Precipitation: -7 mm
Difference from 61-90:
High: +1.8C
Mean: +1.8C
Low: +1.8C
Precipitation: -9 mm |
|
|
|
Post by Steelernation on Aug 31, 2020 23:56:35 GMT -5
 Mean Max: 95.1 f Mean Min: 48.3 f Differences from 1981-2010 Average high: +1.0 f Average low: +0.2 f Mean: +0.5 f Precipitation: -0.15”, -9% Record high: 1995, 2002, 2008 Record low: 1992 |
|
Deleted
Deleted Member
Posts: 0
|
Post by Deleted on Sept 1, 2020 6:04:17 GMT -5
London August 1991-2020
Avg max: 23.4c
Mean: 18.8c
Avg min: 14.1c
Record high: 37.9c
Mean max: 30.6c
Mean min: 9.2c
Record low: 5.9c
Precipitation: 53.6mm
Rain days: 8.7
Sunshine: 192.4 hours
|
|
|
|
Post by Wildcat on Sept 1, 2020 9:47:17 GMT -5
|
|
|
|
Post by Benfxmth on Sept 18, 2020 8:19:18 GMT -5
 Now the precipitation data from GHCND and ECA&D is slightly different from Servizio Meteorologico's 1971-2000 averages on the Climate Atlas page (historical daily data is paid), though they both seem to get the temperatures right. Only 2 monthly record highs from 1991-2020 are also monthly records for the POR (April and May). Temperature/precipitation differences versus the 1981-2010 averages: JanuaryAverage high: +0.4°C Average low: +0.4°C Precipitation: +2.2 mm FebruaryAverage high: +0.5°C Average low: +0.4°C Precipitation: -3.5 mm MarchAverage high: +0.5°C Average low: +0.5°C Precipitation: +3.4 mm AprilAverage high: +0.8°C Average low: +0.6°C Precipitation: -2.3 mm MayAverage high: +0.2°C Average low: +0.3°C Precipitation: +4.9 mm JuneAverage high: +0.6°C Average low: +0.5°C Precipitation: -2.1 mm JulyAverage high: +0.2°C Average low: +0.5°C Precipitation: -1.6 mm AugustAverage high: +0.6°C Average low: +0.7°C Precipitation: +2.2 mm |
|