|
|
Post by Beercules on Mar 15, 2022 2:51:34 GMT -5
Aussie climate experts: Why is Melbourne's eastern suburb of Scoresby relatively wet? It isn't that elevated and it's far more inland, which should make it sort of dry, right? It is wetter than Melbourne CBD and the northern suburbs by 200m+. Can anyone explain? Uplift caused by the Dandenong Ranges. |
|
|
|
Post by Babu on Mar 15, 2022 6:31:47 GMT -5
Aussie climate experts: Why is Melbourne's eastern suburb of Scoresby relatively wet? It isn't that elevated and it's far more inland, which should make it sort of dry, right? It is wetter than Melbourne CBD and the northern suburbs by 200m+. Can anyone explain? Aussie climate experts: Why is Melbourne's eastern suburb of Scoresby relatively wet? It isn't that elevated and it's far more inland, which should make it sort of dry, right? It is wetter than Melbourne CBD and the northern suburbs by 200m+. Can anyone explain? Uplift caused by the Dandenong Ranges. UHI also tends to generate greater precipitation downwind of the UHI. Melbourne has a mostly western tradewind pattern right? Westerlies and so on. Could that contribute to greater precipitation amounts on the eastern side of the city? Especially since there are more mountain ranges to the east I suspect most of the moist winds would be coming from the west. |
|
|
|
Post by Ethereal on Mar 15, 2022 18:24:51 GMT -5
Aussie climate experts: Why is Melbourne's eastern suburb of Scoresby relatively wet? It isn't that elevated and it's far more inland, which should make it sort of dry, right? It is wetter than Melbourne CBD and the northern suburbs by 200m+. Can anyone explain? Uplift caused by the Dandenong Ranges. UHI also tends to generate greater precipitation downwind of the UHI. Melbourne has a mostly western tradewind pattern right? Westerlies and so on. Could that contribute to greater precipitation amounts on the eastern side of the city? Especially since there are more mountain ranges to the east I suspect most of the moist winds would be coming from the west. Good point. I was thinking about Port Phillip bay. The land on its western side is much drier than that of the eastern side. The bay could be a factor... Need knot's input on this though. |
|
|
|
Post by Ariete on Mar 15, 2022 18:28:34 GMT -5
Need knot's input on this though.
You're too late for that.
|
|
|
|
Post by Ethereal on Mar 15, 2022 18:31:22 GMT -5
Need knot's input on this though.
You're too late for that.
He's suspended? |
|
|
|
Post by Ariete on Mar 15, 2022 18:39:09 GMT -5
|
|
|
|
Post by greysrigging on Mar 15, 2022 18:43:32 GMT -5
Melbourne, when you look at a map of Victoria, is actually a long way inland from the southern coastline, and is at the northern most point of Port Phillip Bay. There is a slight Foehn effect with some higher ground to the west, north and east. The land is quite flat on the western side of the Bay between Geelong and Melbourne, in fact this area is generally warmer than the City, particularly on extreme heat days. The eastern suburbs altitude rises gradually towards the 600m of the Dandenongs and hills to the north east are upwards of 900m-1000mm within 70 to 80 klms of the City..  |
|
|
|
Post by Strewthless on Mar 18, 2022 6:33:43 GMT -5
|
|
|
|
Post by psychedamike24 on Mar 18, 2022 20:41:01 GMT -5
|
|
|
|
Post by Crunch41 on Mar 18, 2022 23:29:02 GMT -5
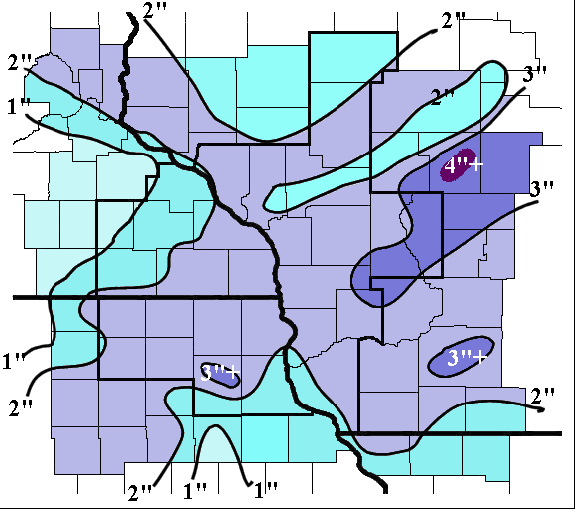
I had an ice storm on 2/22/2022 with about 0.2" / 5mm of ice. The last 2/22/22, 100 years ago, there was a severe ice storm. 1-2" of ice was reported in many areas with up to 4" in Central Wisconsin. Further north saw heavy snow with up to 3 feet somewhere in the northern part of the state (NWS mentions it but didn't say where. Link to story) La Crosse saw 2.05" of precipitation, the wettest February day by far. Second place is just 1.29" in 1983, and the POR is a full 150 years. Graph of ice accumulations centered on the Minnesota/Iowa/Wisconsin border.   A news article from Hurley in the snowiest part of the state. The snow was deep enough to stop trains for a few days.
It was 1922 so I only found 2 pictures.

This site has newspaper articles covering the storm.
"The Princeton Telephone Co. has suffered an immense loss. Nearly every pole throughout the rural district is down and the wires are a mass of entanglement. Nearly every line of the Princeton Electric Light Department was down..."
School stayed open, but there was no power or mail for about a week in Princeton and it took until at least April to get the phone lines fixed. Princeton is in the 2-3" zone on the map. It has about the same population now as it did in 1920 (1200 people). Another story in the 1922 paper was celebrating their first tourist of the year...in March.  |
|
|
|
Post by Ariete on Mar 20, 2022 8:03:49 GMT -5
Nooooooooooo, the rediculous UHI station in Tampere has shut down. Actually happened already on 10 February, but hadn't noticed it before.
Rip Tampere botev station, fark.
|
|
|
|
Post by greysrigging on Mar 21, 2022 3:04:29 GMT -5
|
|
|
|
Post by Steelernation on Mar 27, 2022 14:32:51 GMT -5
Here are the median daily values for highs and lows for each month in Fort Collins. The median is always higher than the mean, showing that most days are above average. This makes sense as downward variation is much bigger than upward variation here.
46.0 (+1.5) 19.5 (+1.2)
48.5 (+1.7) 22.5 (+1.8)
57.5 (+1.1) 29.0 (+0.5)
63.5 (+1.0) 35.5 (+0.1)
72.0 (+1.1) 45.0 (+0.9)
82.5 (+0.7) 53.5 (+0.7)
88.0 (+0.6) 59.5 (+0.8)
86.0 (+1.0) 56.5 (0)
78.5 (+1.1) 48.5 (+0.5)
65.0 (+0.7) 36.5 (+0.4)
53.5 (+1.0) 27.5 (+1.4)
45.0 (+1.0) 19.5 (+1.2)
65.5 (+1.0) 37.5 (+0.5)
|
|
|
|
Post by greysrigging on Mar 30, 2022 14:45:09 GMT -5
Last day of March in AU  |
|
|
|
Post by Met.Data on Apr 1, 2022 19:48:09 GMT -5
I have to be honest, this Gaypril and the horrific forecast really is quite depressing. Ugh.
|
|
|
|
Post by Met.Data on Apr 6, 2022 11:10:11 GMT -5
So the weather's gonna stink for the foreseeable future which means I lose interest in it basically, no foreskincasts for me for a while. Might get into my other hobbies like weight training, so I can more easily beat up people who annoy me.
|
|
|
|
Post by Strewthless on Apr 8, 2022 6:29:59 GMT -5
Summer 2022 was a good one. Time to put the suncream away and get the Christmas tree up.  |
|
|
|
Post by greysrigging on Apr 12, 2022 15:34:03 GMT -5
Still hot throughout the Central Northern Territory. Rabbit Flat set a new April max temp record for the site 41.0c.  |
|
|
|
Post by Ethereal on Apr 15, 2022 7:50:23 GMT -5
How the Southern Annular Mode (SAM) affects Australia:  |
|
Deleted
Deleted Member
Posts: 0
|
Post by Deleted on Apr 19, 2022 19:54:24 GMT -5
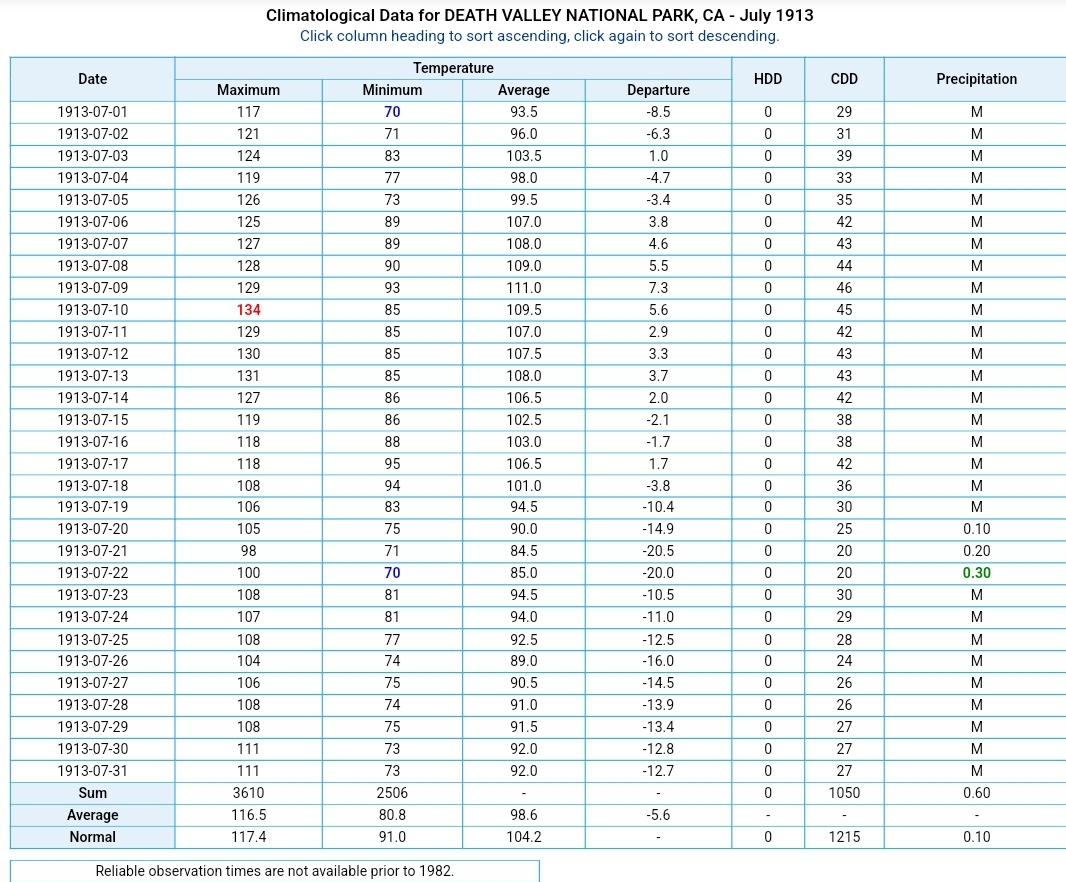
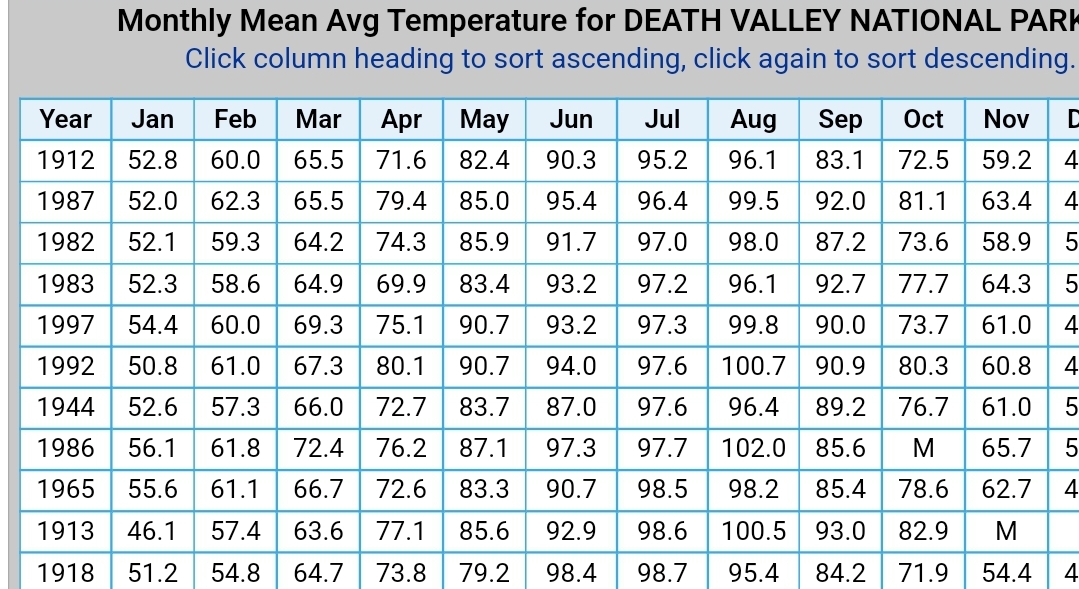
July 1913 in Death Valley was actually a cooler than average month, especially the minima and the second half, even including the "134 °F" reading... The 21st recorded 98/71 °F with 0.2" rain, and the next day recorded 100/70 °F with 0.3" rain.  Also July 1913 was the 10th coolest July in Death Valley since records began in 1911 (9 Julys from 1911-2021 are missing mean temp data)  |
|